Old Orchard Beach, ME, USA apartments for sale
$725,000
$725,000
Available: Right Now
This light and airy open floor plan with vaulted ceilings and charming built-ins will surely make you fall in love with this almost new home in Sawgrass. Convenient one-level, open-concept living with beautiful finishes such as quartz countertops, st...
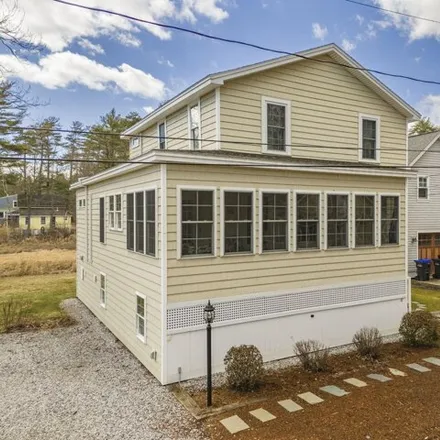
$849,900
$849,900
Available: Right Now
Welcome to 'Double Pleasure' in this great Ocean Park location! The three season porch (18'x6') is the perfect spot for breakfast, lunch, morning coffee, or watching folks walk to the beach or downtown. The porch leads you to a den/TV room, which can...
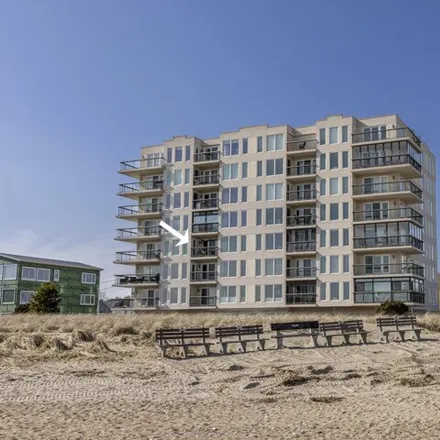
$890,000
$890,000
Available: Right Now
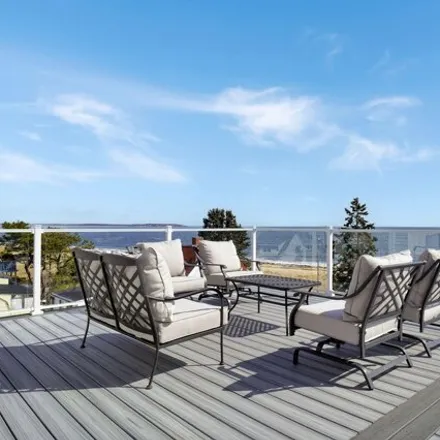
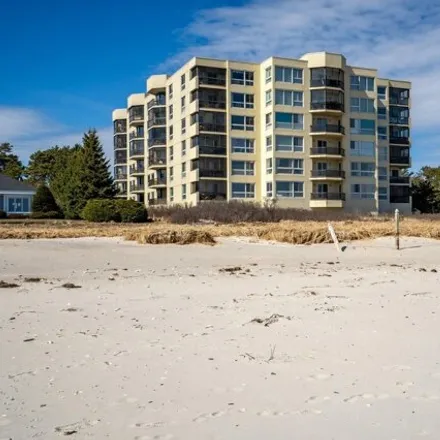
Best maine beach is right out your door with views from every room. Beautifully updated condo with center deck and access from living area and both bedrooms. Updated kitchen with center island, granite counters and Nu-Wave backsplash. Being so...
$208,000
$208,000
Available: Right Now
Welcome to the seaside community of Old Orchard Beach! Don't miss the opportunity to own this 1 bedroom condo unit that is efficient to heat, close to the turnpike, free laundry, and is just a short drive to 7 miles of sandy beach. Low condo fees and...
$831,000
$831,000
Available: Right Now
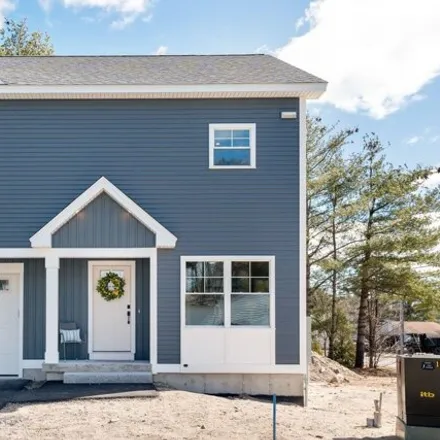
Looking for a condo that lives like a single family home without all the yard work? Here it is. Enjoy the serenity of the wooded back yard while sitting on your back deck or looking out from the daylight basement. This stunning 3 bedroom 2.5 bath dup...
$119,995
$119,995
Available: Right Now
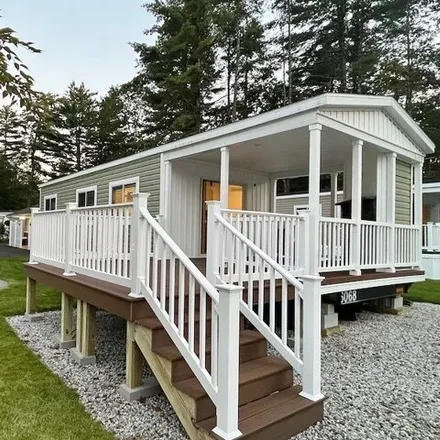
Relax in your 8 covered front porch with upgraded composite decking. Need a King bed? We have one in this beautiful unit with an oversized main bedroom and loft for storage or the occasional guest! Park Model includes pull out couch and recliner and ...
$179,995
$179,995
Available: Right Now
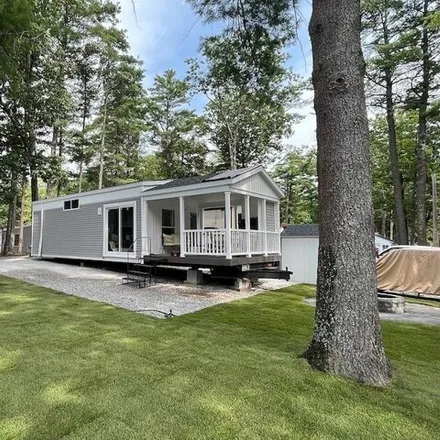
Check out this Brand new, custom Shore Park by Skyline park model! Package will include Wayfair interior furniture and dcor, 10 x 29 Florida Room, composite matching exterior deck with inlaid stairs and white vinyl railings. Enjoy your propane...
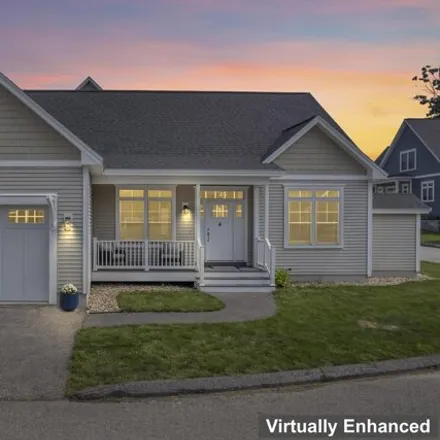
$475,000
$475,000
Available: Right Now
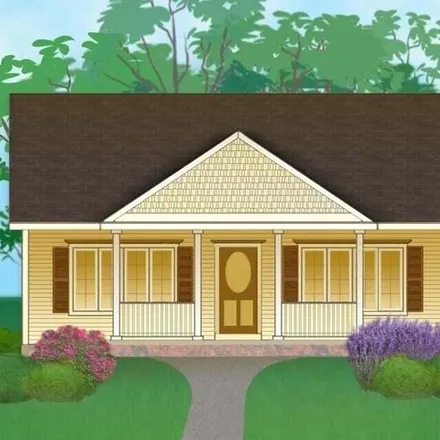
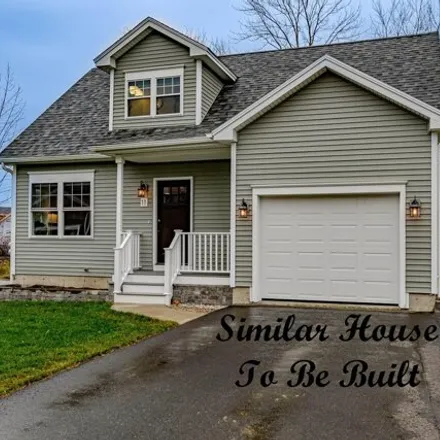
Only 20 of our 22 homes now remain at our newest Beach community - heritage woods - so if you've been looking for brand new construction near the Beaches, under$475K -look no further than our Classically New England entry level Rodeo model at ...
$159,995
$159,995
Available: Right Now
Two bedroom park models are HERE! This custom Shore Park by Skyline model includes a queen bed in the main bedroom and a full/twin bunk combination for the second bedroom! Love an outdoor porch? Enjoy your propane fireplace right from your covered po...

$675,000
$675,000
Available: Right Now
Beautiful 2 bedroom - 2 bath condo at Old Orchard's premiere destination, The Grand Victorian! This well cared for unit has many updates and is well appointed throughout! Granite countertops, high end flooring, large closets, spacious kitchen, and co...
$1,28M
$1,28M
Available: Right Now
Welcome to your Quintessential Maine summer retreat or ideal year round home! Step inside this one-of-a-kind condo located just a few short steps to one of Maine's most pristine beaches with million dollar panoramic views! This stunning three story c...
$229,000
$229,000
Available: Right Now
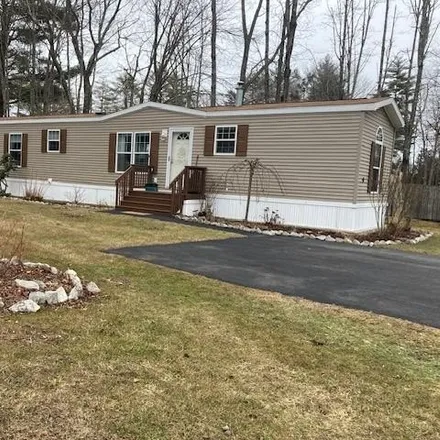
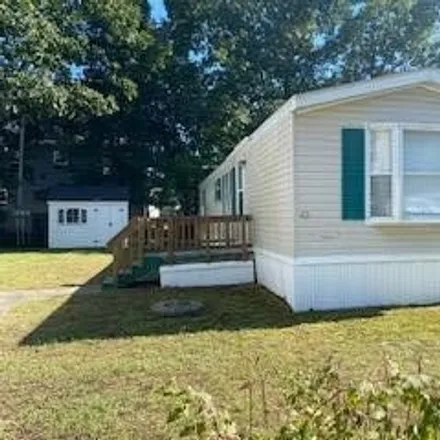
Dream Home !! Old orchard village. Year round single wide mobile home. Minutes to the ocean.. Absolutely, one of a kind. Prestine interior... Whole house Generac generator, central air cond. 8X10 double door vinyl shed. ''Stainless steel'' app...
$400,000
$400,000
Available: Right Now
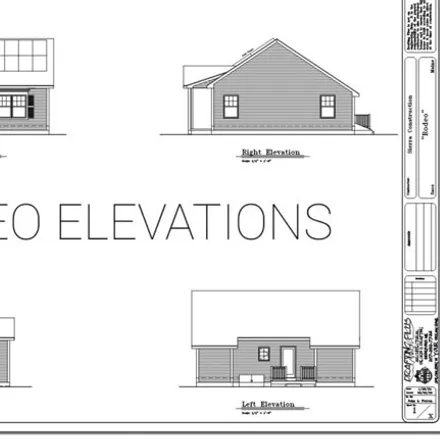
$481,000
$481,000
Available: Right Now
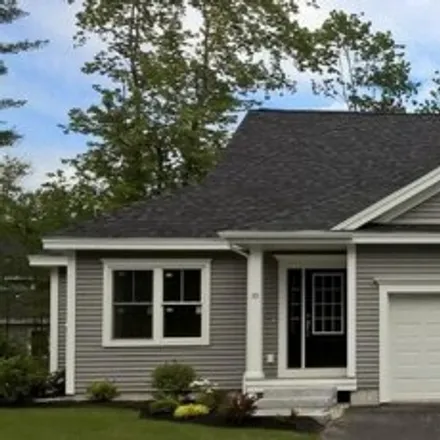
This art rendering is representative (not exact!) of the ''Stanford'' plan being offered at Heritage Woods. Solar Array roof panels are optional for$18, 000.The Stanford is a ranch style, 2 bedroom, 1 bath unit that accommodates one floor living. The...
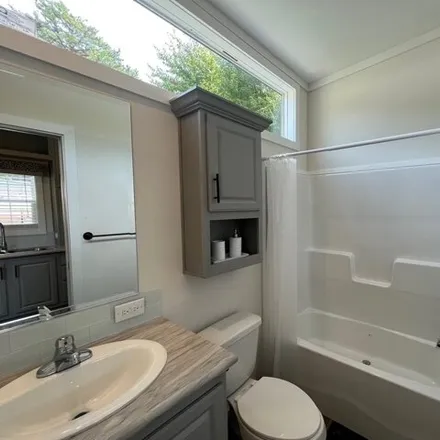
$680,000
$680,000
Available: Right Now
Seize the wonderful opportunity to reside at one of Maine's popular beaches in this beautifully remodeled condo boasting a custom kitchen with stainless appliances, leathered dekton countertops, and lots of cabinet space, accented with delightful flo...
$125,000
$125,000
Available: Right Now
Step into this well maintained singlewide mobile home and start enjoying yourself right away. Nothing to do but add your personal touches. Situated perfectly within desirable Old Orchard Village. Affordably priced! Located conveniently to the beach, ...
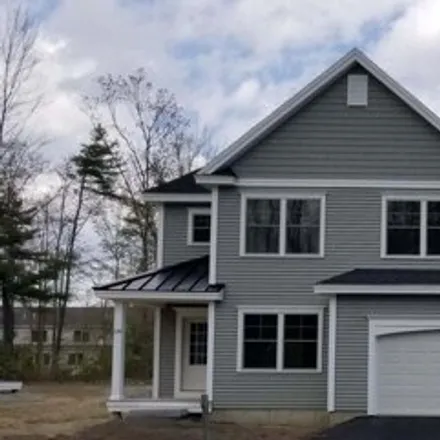
$669,000
$669,000
Available: Right Now
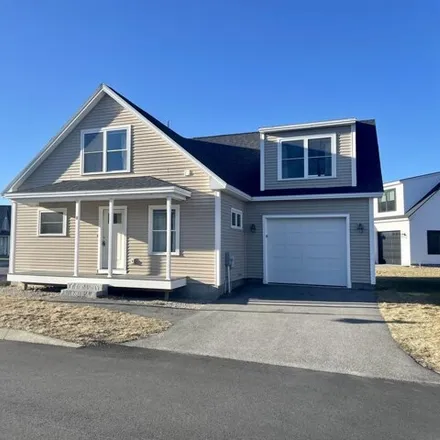
Welcome to 8 Woods Ln! This 3 bedroom 2.5 bath home is ideally located in the well maintained and highly desirable Dunegrass community just steps from the club house. Enjoy the luxury of your spacious primary bedroom which offers an en suite bath wit...
$899,000
$899,000
Available: Right Now
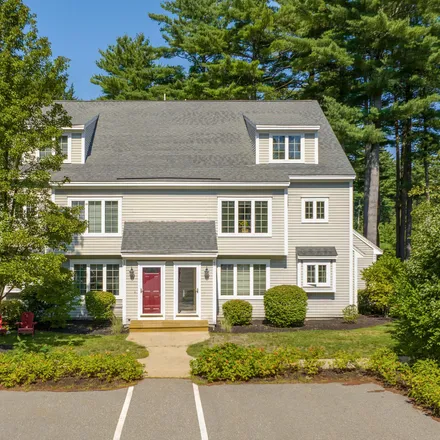
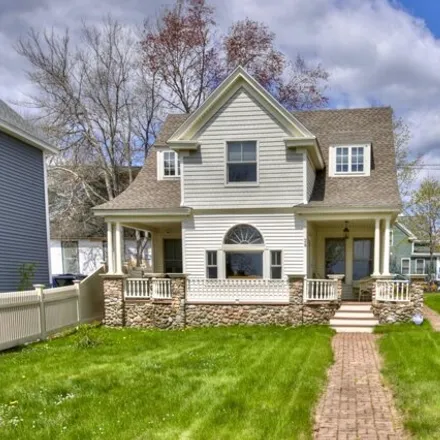
Absolutely charming 4-bedroom, 2-bathroom home boasting a delightful blend of 1890s original character and modern updates! Renovated in 2015, this gem preserves its stained glass windows, tin ceilings, and ornate trim, while offering refurbished sout...
$659,000
$659,000
Available: Right Now
This is the Manchester II and the price includes full Solar Array. The solar panels are on the back roof. If you chose to not include the solar, deduct$18, 000for this price. There are 7 plans priced from$499, 000-$725, 000 (PricesINCLUDEsolar). Site...
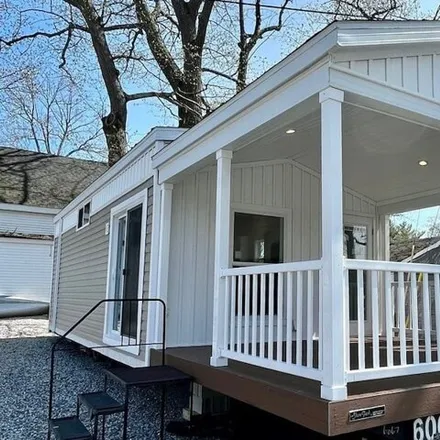
$179,995
$179,995
Available: Right Now
Now this is a vacation home! Check out this Brand new, custom Shore Park by Skyline park model! Sale package will include Wayfair interior furniture and dcor, 10 x 29 Florida Room, composite matching exterior deck with inlaid stairs and white ...
$671,500
$671,500
Available: Right Now
Stunning, efficiently designed, single level condominium. Open concept with gas fireplace, large Kitchen with island and pantry. This light-filled condo is so welcoming! Perfect downsizing option. Come enjoy easy living in this wonderful community. D...
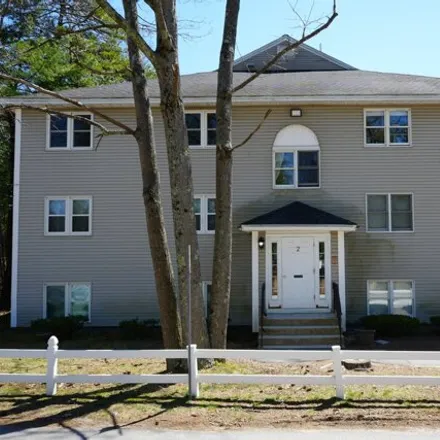
$489,900
$489,900
Available: Right Now
Welcome to our luxurious 12-unit condo complex, where modern living meets sophisticated design! Nestled in a serene setting located less than 5 minutes from the beach, each unit boasts contemporary elegance and thoughtful amenities to enhance your li...
Old Orchard Beach
According to statistics, the population in Old Orchard Beach, ME amounts to 8,745, which shows decline 0% compared to the previous year. The median age of the city’s residents is 53. The average household income is $50,663, shifting growth 16% from the past year, and the average property value in Old Orchard Beach, ME growth 2% to $204,700 throughout the year.
| Population | 8,745 |
| Median Age | 52.6 |
| Poverty Rate | 8% |
| Household Income | $50,663 |
| Number Of Employees | 4,824 |
| Median Property Value | $204,700 |
Household Income
The average household income in Old Orchard Beach, ME grew from $43,523 to $50,663 in the past year. This data is an estimate based upon 4,686 households in Old Orchard Beach, ME . The chart below presents how household income is distributed in Old Orchard Beach, ME in comparison to the revenue allocation amid households nationally.
Property Value
According to data from last year, the average property value in Old Orchard Beach, ME shifted from $200,200 to $204,700 throughout the year. The subsequent graph indicates the share of properties in the given price range in Old Orchard Beach, ME in comparison to the median property value in the same price segment across the country. According to the data, the greatest share of Old Orchard Beach, ME properties falls in the '$200,000 to $249,999' range, which is lower than the most significant median property across the country.
Rent vs. Own
Property Taxes
One of the most important aspects for property owners is the amount of property taxes. This graph shows distribution of property taxes in Old Orchard Beach, ME compared to median property taxes around the country. The prevalent amount of property taxes in Old Orchard Beach, ME equals $3000, which is less than the national average.