Orange Beach, AL, USA apartments for sale
$2,13M
$2,13M
Available: Right Now
Rare 15th Floor - Four Bedroom, Four Bath Residence on the East Side with Breathtaking Unobstructed Views: Before the tower was built, this condo underwent a complete redesign, making it a unique offering that stands out from the standard floor plans...
$1,88M
$1,88M
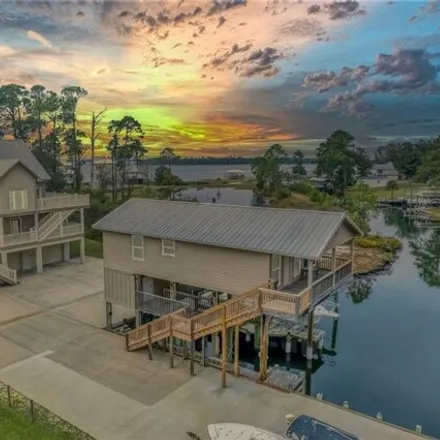
Available: Right Now
Waterfront gem! Custom home located on the picturesque Bay La Launch, a boater's paradise! Sitting directly on the Bay is a custom-built boat dock with a 40' slip and a second slip under the guest house that includes a12, 000lb boat lift. The main ho...
$1,3M
$1,3M
Available: Right Now
Luxury Waterfront Community on Cotton Bayou! Prime location in the heart of Orange Beach. This development features a large zero entry pool with sun shelves, brick paved streets, and a marina. Each home has an assigned Covered boat slip ! Slip...
$369,000
$369,000
Available: Right Now
Discover the hidden gem of Grand Caribbean, a paradise for outdoor enthusiasts and savvy investors! This complex boasts an unbeatable location, providing easy access to the beach, walking and bicycling trails, boating, canoeing, fishing, and the conv...

$649,900
$649,900
Available: Right Now
Rare find in Phoenix IV! This one is a rental machine. Sold fully furnished and rent ready! Rentals can transfer to new owner. Beautifully decorated located on the 2nd floor overlooking the pool and directly on the beach! Split bedroom plan perfect f...

$699,000
$699,000
Available: Right Now
This premier unit within the Cotton Bayou Condominium complex is a standout choice. Unit 10D is a beautifully renovated 4-bedroom, 3-bath unit with an additional loft, offering unobstructed views of Cotton Bayou in the heart of Orange Beach. Finding ...

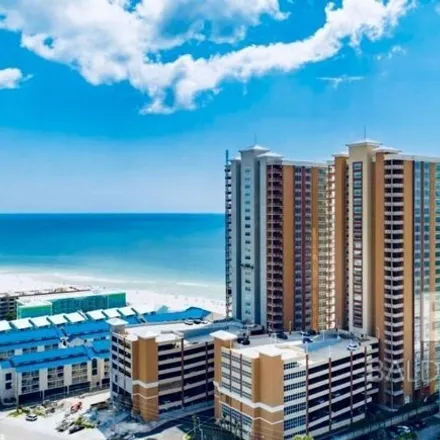
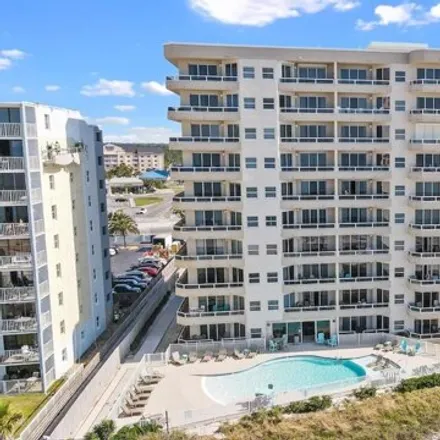
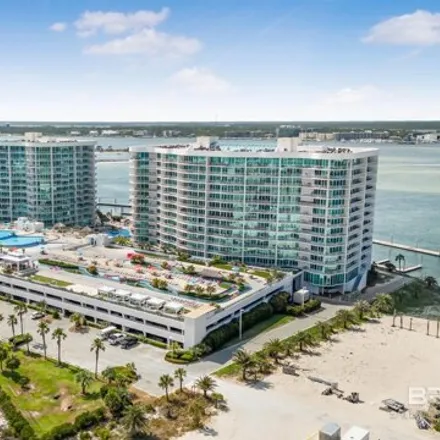
$2,15M
$2,15M
Available: Right Now
Welcome to The Oasis at Orange Beach! Unit 1901 is the perfect mix of relaxation and recreation. This 4 bedroom, 4 bathroom spacious west corner with endless beach views as far as you can see. Unit 1901 features tile throughout, granite countertops i...
$925,000
$925,000
Available: Right Now
Stunning three bedroom, three bath 9th floor condominium unit at The Enclave in Orange Beach! Phenomenal views of the Gulf of Mexico from the living area and master bedroom. Tiled throughout, the kitchen offers stainless steel appliances, granite cou...

$10,75M
$10,75M
Available: Right Now
Discover luxury in this exquisite7, 187sq ft Gold Fortified Estate, situated on 3.3 acres in Orange Beach, AL. Featuring 5 bedrooms and 7.5 bathrooms, this home is a masterpiece of design and comfort.The grand kitchen is equipped with custom cabinetr...

$2,2M
$2,2M
Available: Right Now
Phoenix Gulf Towers Unit 1801 is a Stunning corner unit condo that offers Spectacular views of the beach and Gulf State Park!! This is one of the few 4 bedroom, 4 BATHcondos that has been built in the last 15 years! This is one you won'...
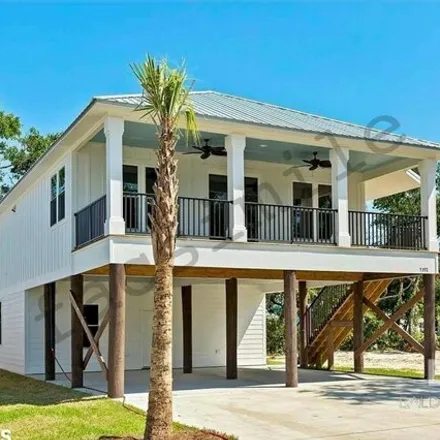
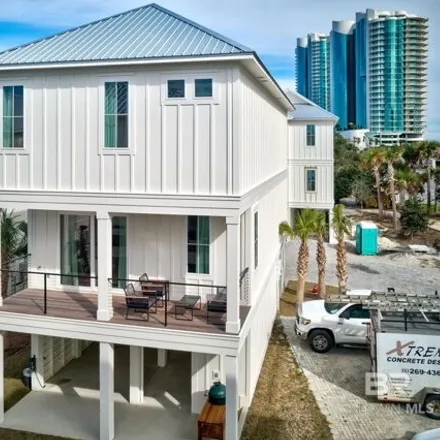
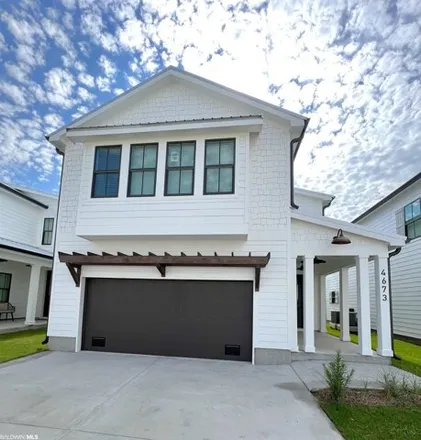
$759,900
$759,900
Available: Right Now
Stunning new construction home in the prestigious Bear Point Estates. Currently in preconstruction. This home allows the purchaser the unique opportunity to select some of their own finishes including countertops, paint, fixtures and finishes ensurin...
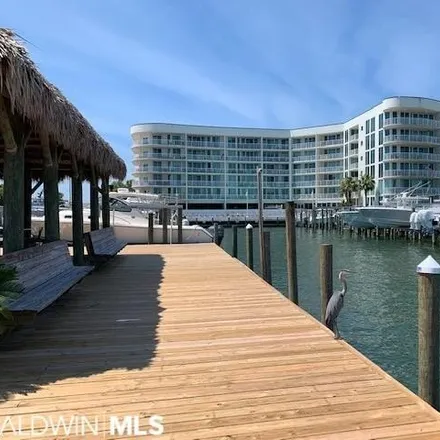
$1,1M
$1,1M
Available: Right Now
Best of Both Worlds from this Stunning Fifth Floor Condo that will put Boaters and Beach Lovers in Paradise. White Sandy beach just steps away. Large boat slip M-14 that has20, 000lb Deco boat lift with water and power. Private covered parking space ...
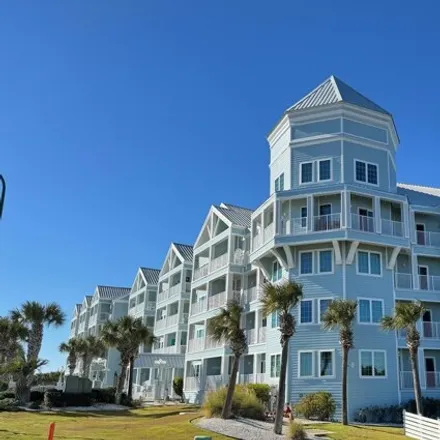
$765,000
$765,000
Available: Right Now
This Beach front condo, located in the heart of Orange Beach, is decorated in Pottery Barn furniture collection and comes fully furnished, giving you all of the comforts of home in a beach-side tropical paradise. Unit 1504 is ideally situated ...

$237,500
$237,500
Available: Right Now
Conveniently nestled just minutes away from the pristine sugar-white sands of Orange Beach and Gulf Shores, this charming townhome-style condominium awaits in the peaceful enclave of Creekside Villas. Boasting a single-level layout, this home feature...
$1,15M
$1,15M
Available: Right Now
Experience waterfront luxury living at its finest in this stunning 3-bedroom, 3-bathroom Caribe unit boasting breathtaking views. This eighth-floor oasis in Tower D is not just a home but a proven rental gem, fully furnished for immediate enjoyment. ...
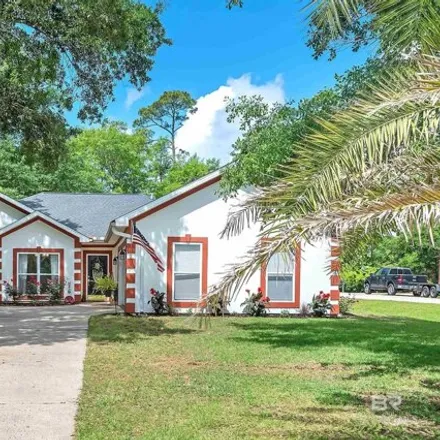
$649,000
$649,000
Available: Right Now
Wonderful 3/2 home located in Gulf Shores in a prime location with some great features! A desirable neighborhood with convenient access to amenities is always a plus. Having a boat slip adds an extra layer of convenience, especially for water enthusi...
$559,900
$559,900
Available: Right Now
Offering$15, 000towards closing cost and a free golf cart.This beautiful Gold Fortified home offers both convenience and luxury! Boasting bay views and sea breezes, this could be your perfect getaway on Alabama's premier gulf coast. The Sunset Plan f...
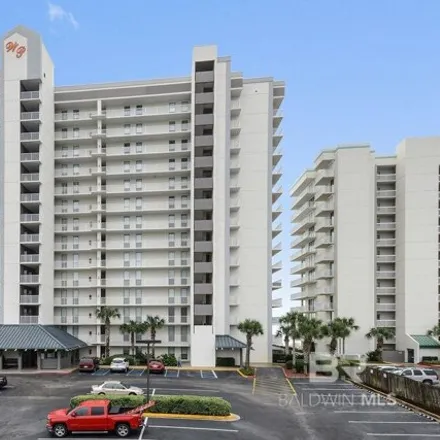
$630,000
$630,000
Available: Right Now
Incredible Gulf view from this 8th floor condo! Nicely decorated 2 bed unit; tile throughout, updated kitchen cabinets, with beautiful backsplash and granite counter tops. Both bathrooms have been updated, too! Phoenix II recently installed new high ...
$439,999
$439,999
Available: Right Now
Come see this fully furnished 2 bed/2 bath condo at Bayview! This unit is so pleasingly decorated and up to date. You will enjoy stainless steel appliances and a stackable washer and dryer located in the guest bath. The master bedroom also includes a...
$698,510
$698,510
Available: Right Now
This east corner gulf front condo has Unobstructed views from your private balcony. It is only a short distance from the private boardwalk and clean sugar white sand beaches on the Gulf of Mexico. There is a large gulf side pool, children's po...
$580,000
$580,000
Available: Right Now
Centrally located to all the action, the Wharf is the perfect place to be! From the beautiful 5th floor views of the Wharf marina to the spacious layout, this unit will NOT disappoint! Just take the elevators down to the first floor and everything yo...
$475,000
$475,000
Available: Right Now
A waterfront, top floor end unit, non-rental and Renovated boaters dream that has deeded beach access. Charter Landing Condominiums is an exclusive, low density complex that is strategically located on a protected canal that is your per...
Orange Beach
According to statistics, the population in Orange Beach, AL amounts to 5,826, which shows decline 1% compared to the previous year. The median age of the city’s residents is 54. The average household income is $69,388, shifting growth 17% from the past year, and the average property value in Orange Beach, AL growth 3% to $256,600 throughout the year.
| Population | 5,826 |
| Median Age | 53.9 |
| Poverty Rate | 8% |
| Household Income | $69,388 |
| Number Of Employees | 2,717 |
| Median Property Value | $256,600 |
What is the Average Price of Apartments for Sale in Orange Beach, AL?
| Month | Median Price |
|---|---|
| Jun 2024 |
$430,310
|
| May 2024 |
$427,491
|
| Apr 2024 |
$409,753
|
| Mar 2024 |
$409,753
|
| Feb 2024 |
$409,753
|
| Jan 2024 |
$409,753
|
| Month | Median Price |
|---|---|
| Jun 2024 |
$741,601
|
| May 2024 |
$1,109,206
|
| Apr 2024 |
$854,649
|
| Mar 2024 |
$854,649
|
| Feb 2024 |
$854,649
|
| Jan 2024 |
$854,649
|
Household Income
The average household income in Orange Beach, AL grew from $59,523 to $69,388 in the past year. This data is an estimate based upon 2,578 households in Orange Beach, AL . The chart below presents how household income is distributed in Orange Beach, AL in comparison to the revenue allocation amid households nationally.
Property Value
According to data from last year, the average property value in Orange Beach, AL shifted from $248,200 to $256,600 throughout the year. The subsequent graph indicates the share of properties in the given price range in Orange Beach, AL in comparison to the median property value in the same price segment across the country. According to the data, the greatest share of Orange Beach, AL properties falls in the '$250,000 to $299,999' range, which is higher than the most significant median property across the country.
Rent vs. Own
Property Taxes
One of the most important aspects for property owners is the amount of property taxes. This graph shows distribution of property taxes in Orange Beach, AL compared to median property taxes around the country. The prevalent amount of property taxes in Orange Beach, AL equals $800, which is less than the national average.