Ormond Beach, FL, USA apartments for sale
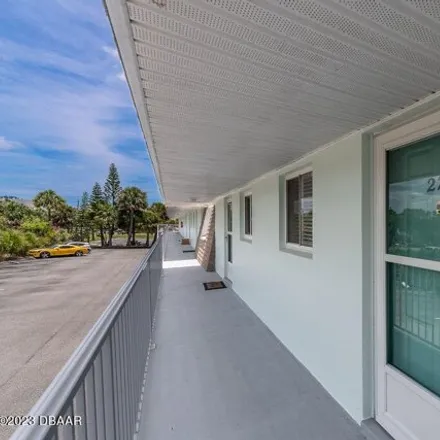
$232,900
$232,900
Available: Right Now
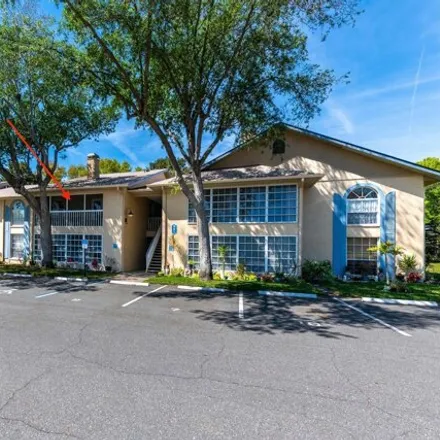
All aboard, your next stop is Wellington Station! This charming condo community is centrally located in sought after Ormond Beach near City parks, the beach, shops, dining, public transportation, medical facilities, and houses of worship. In addition...
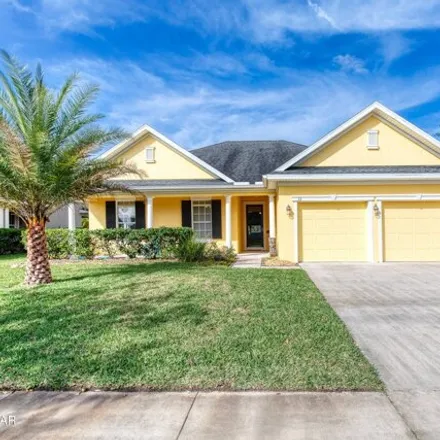
$750,000
$750,000
Available: Right Now
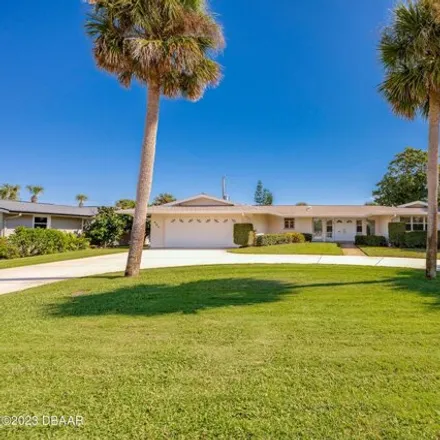
Unbeatable Value! In the heart of the exclusive Oceanside Country Club, a rare gem awaits. Imagine starting your mornings with a steaming cup of coffee on the lanai, basking in the glow of a beautiful sunrise, or winding down with a glass of wine whi...
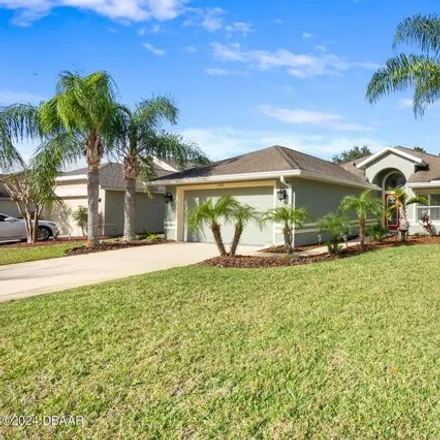
$460,000
$460,000
Available: Right Now
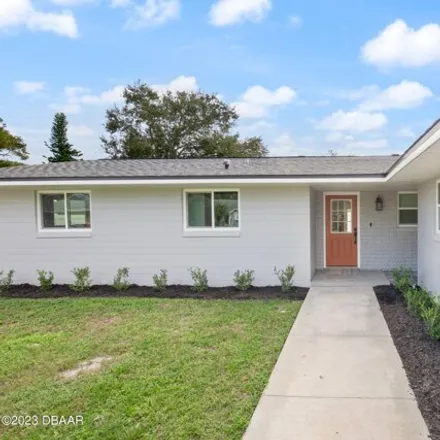
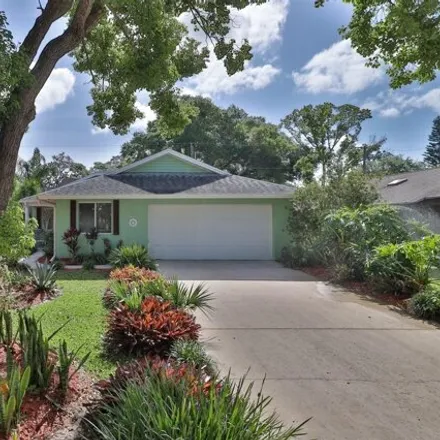
Let's dive right into this Pool Home and see what this beauty offers! Quiet and established neighborhood. One story, block fully renovated open concept is within walking distance to shopping and eateries. 10 minutes from gorgeous beaches. Better than...
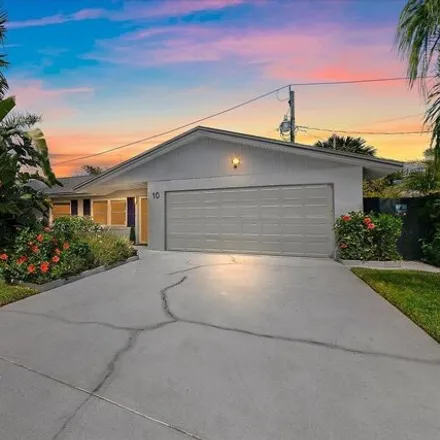
$459,000
$459,000
Available: Right Now
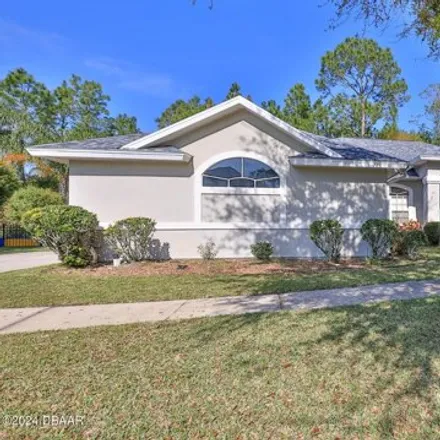
Welcome to the picturesque Hunters Ridge neighborhood, where this charming abode eagerly awaits its new owner! Lovingly maintained, this delightful residence boasts a thoughtful layout featuring 3 bedrooms and 2 baths in a split floor plan design.Ste...

$370,000
$370,000
Available: Right Now
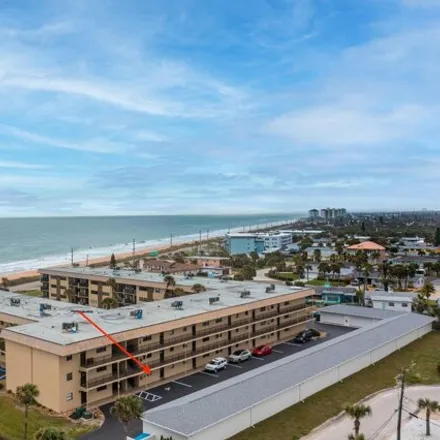
Discover tranquility in this charming oceanfront townhouse boasting 2 bedrooms and 2.5 bathrooms. Breathtaking views greet you from every corner, offering a serene retreat from the hustle and bustle of daily life. Embrace coastal living with direct b...
$224,900
$224,900
Available: Right Now
Completely renovated condominium with granite tops and all kitchen appliances. Walk to the ocean, the Casement park, and all shopping conveniences Tile floors in kitchen and bathrooms. Vinyl wood plank flooring thru out. Oak treads on stairs. NO Carp...
$479,900
$479,900
Available: Right Now
3 bedrooms, 2 baths, 3 car garage. Open floor plan with center kitchen island overlooking the focal shiplap wall in living area. The windows stretch the entire living room with views of the backyard oasis, extended patio with decorative yard lighting...
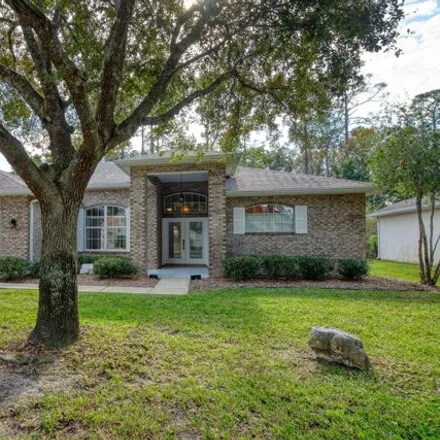
$424,900
$424,900
Available: Right Now
Charming 3 bed, 2 bath, Captiva model situated on an oversized corner lot in the highly sought after community of Plantation Bay. As you step inside through the etched glass front door you'll be greeted by an inviting and open floor plan that is brig...
$469,900
$469,900
Available: Right Now
Imagine hearing the ocean waves from your front door and being able to walk to the serene beaches of Ormond by the Sea in just minutes! This coastal home has it all and boasts aNEW ROOFand so many tasteful and carefully thought out updates throughout...
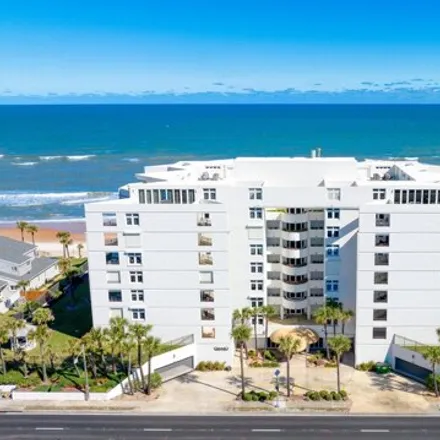
$565,000
$565,000
Available: Right Now
Fall in love at this incredible third floor 1-owner unit in the Tidesfall Condominium in the heart of Ormond's beachside! This unit with three full balconies gives great ocean views by day and stunning city views up the peninsula by night. With more ...
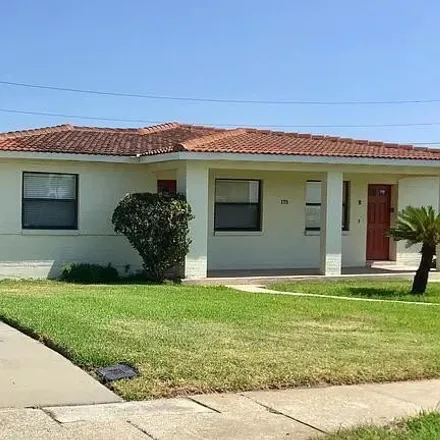
$459,000
$459,000
Available: Right Now
In the charming historic community of Ocean Village, #175-A Cardinal will shock and amaze you. The facade of is rightfully in keeping with the nature of The Village, but this was rebuilt with luxury and style in mind. Much more than the original ever...
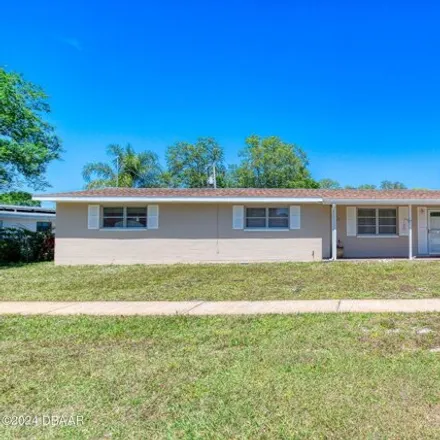
$349,000
$349,000
Available: Right Now
Welcome to your serene retreat in the heart of Ormond Beach! This charming 3-bedroom, 2-bathroom pool home rests gracefully on a generous corner lot, offering both space and privacy. Upon entry, you're greeted by a formal living room, offering a comf...
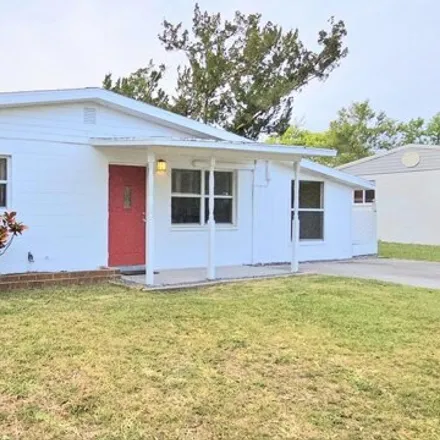
$255,000
$255,000
Available: Right Now
Wow, talk about the old saying, ''location, location, location'', well, this 3/2 in the heart of Ormond Beach really is!! Nestled between Rogers Park Drive and Sylvania Place, this property features two entrances from the front and rear! Convert 3rd ...

$309,900
$309,900
Available: Right Now
Beautifully remodeled concrete block home in sunny Ormond-by-the-Sea. Roof replaced in 2021, new HVAC in2023. 2bedrooms and 1 bathroom with almost new everything. 1 car garage. Quiet neighborhood just a hop, skip and a jump away from the beach and th...
$299,000
$299,000
Available: Right Now
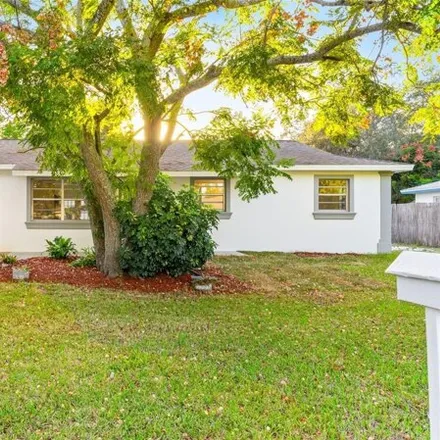
Discover this charming home centrally located in Ormond Beach. Enjoy easy access to major shopping, restaurants and entertainment. Just a mere short drive to the beach. Oak wood floors throughout and tile in the kitchen and baths. Lush tropical lands...

$388,000
$388,000
Available: Right Now
Seller motivated !! $ 3, ooo towards buyer ' S closing cost with full price offer !! Beautiful house just minutes to the beach completely renovated !! New Kitchen, New Bathrooms, Quartz in all counter tops, Stainless Steel...
$325,000
$325,000
Available: Right Now
Your beachside vacation paradise awaits. This updated fully furnished condo is ready with a private dunes walkover to the no drive beach. The deeded garage is now complete with room for your car and beach toys. All assessments have been paid and all ...
$445,000
$445,000
Available: Right Now
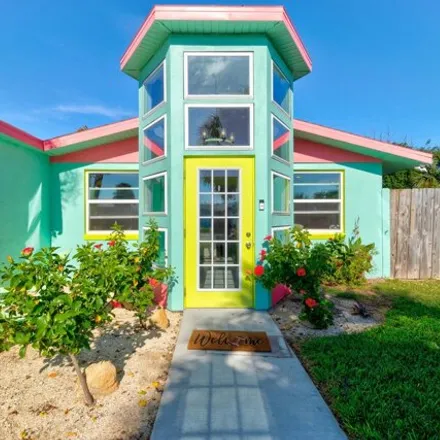
This unique Key West inspired, completely renovated, 4 bedroom/2 bath beach house is the perfect place to call home. As you step inside the beautifully designed entryway, you will be bathed in sunlight. Between the newer windows and the recessed LED ...
$292,900
$292,900
Available: Right Now
One or more photo(s) has been virtually staged. Welcome to your dream home in the heart of town! This fully rehabbed concrete block residence on an oversized lot is a testament to modern living at its finest. As you step inside, be prepared to be cap...
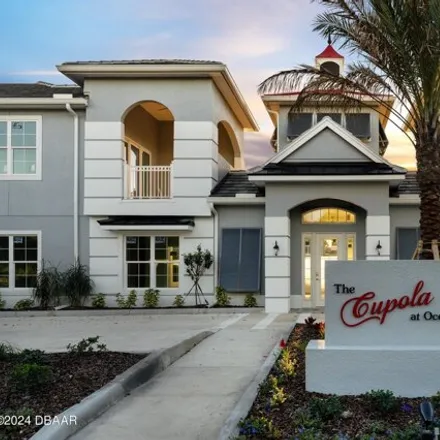
$925,000
$925,000
Available: Right Now
We are pleased to introduce you to the Cupola at Oceanside! Built by Bomar Construction, this stunning gated townhouse development is located in the heart of Ormond Beach within walking distance of the beach, Granada bridge, Fortunato Park, Oceanside...
$449,000
$449,000
Available: Right Now
Breakaway Trails! 3 bedroom, 2 1/2bathroom, 2 car garage offered fully furnished! This home shows like a model! Nestled in a secure gated community, this property boasts a private backyard providing serene outdoor space for relaxation or entertaining...

$2,5M
$2,5M
Available: Right Now
Experience the epitome of luxury riverfront living on the highly sought-after North Beach St. in Ormond Beach. Boasting over 4600 living SF., this meticulously designed 4 bedroom, 3.5 bath home is adorned with exquisite fixtures and updates and is mo...
Ormond Beach
According to statistics, the population in Ormond Beach, FL amounts to 41,238, which shows growth 1% compared to the previous year. The median age of the city’s residents is 52. The average household income is $51,152, shifting growth 4% from the past year, and the average property value in Ormond Beach, FL growth 4% to $176,900 throughout the year.
| Population | 41,238 |
| Median Age | 51.5 |
| Poverty Rate | 9% |
| Household Income | $51,152 |
| Number Of Employees | 16,937 |
| Median Property Value | $176,900 |
What is the Average Price of Apartments for Sale in Ormond Beach, FL?
The average sale price for apartment in Ormond Beach, FL: $98,395
(0%)
| Month | Median Price |
|---|---|
| Apr 2024 |
$113,312
|
| Mar 2024 |
$113,312
|
| Feb 2024 |
$113,312
|
| Jan 2024 |
$113,312
|
| Dec 2023 |
$78,178
|
| Nov 2023 |
$87,882
|
| Month | Median Price |
|---|---|
| Apr 2024 |
$98,395
|
| Mar 2024 |
$98,395
|
| Feb 2024 |
$98,395
|
| Jan 2024 |
$98,395
|
| Dec 2023 |
$78,178
|
| Nov 2023 |
$87,882
|
Household Income
The average household income in Ormond Beach, FL grew from $48,978 to $51,152 in the past year. This data is an estimate based upon 17,384 households in Ormond Beach, FL . The chart below presents how household income is distributed in Ormond Beach, FL in comparison to the revenue allocation amid households nationally.
Property Value
According to data from last year, the average property value in Ormond Beach, FL shifted from $169,900 to $176,900 throughout the year. The subsequent graph indicates the share of properties in the given price range in Ormond Beach, FL in comparison to the median property value in the same price segment across the country. According to the data, the greatest share of Ormond Beach, FL properties falls in the '$150,000 to $174,999' range, which is lower than the most significant median property across the country.
Rent vs. Own
Property Taxes
One of the most important aspects for property owners is the amount of property taxes. This graph shows distribution of property taxes in Ormond Beach, FL compared to median property taxes around the country. The prevalent amount of property taxes in Ormond Beach, FL equals $3000, which is less than the national average.