Philadelphia, PA, USA apartments for sale
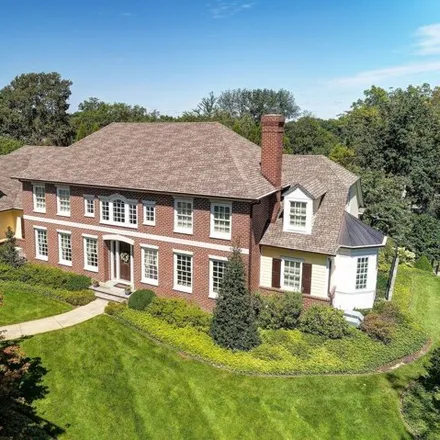
$3,25M
$3,25M
Available: Right Now
This Blue Chip address will belong to you when you move into this elegant Federal Colonial Estate on Winding Way. This home has it all. Every luxury was thought of. This prestigious home was designed by Thom Wagner and built by Daryl Vermaat. You ent...
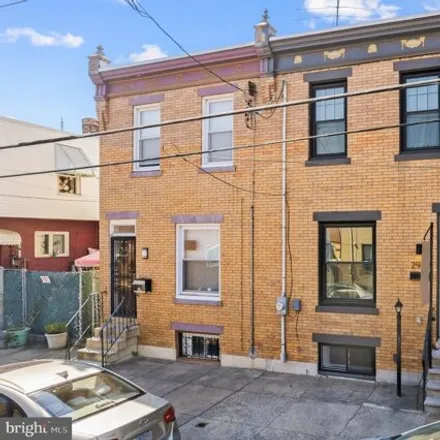
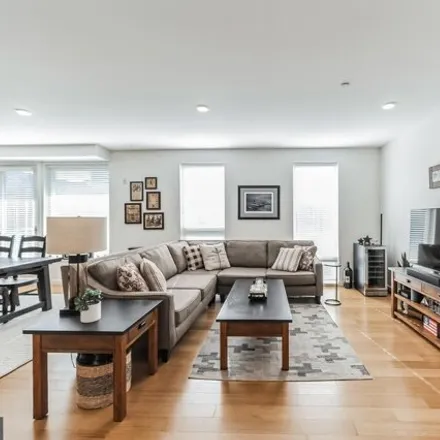
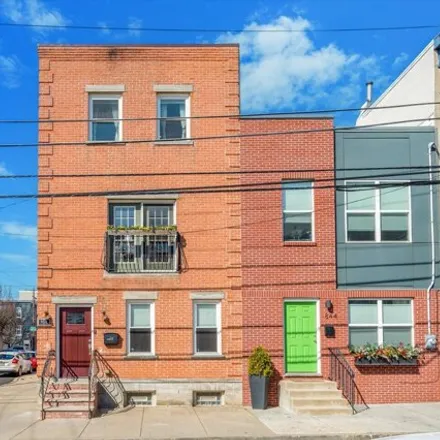
$340,000
$340,000
Available: Right Now
Welcome to this sophisticated home nestled in the vibrant Port Richmond neighborhood. This stunning residence boasts three spacious bedrooms and two luxurious full bathrooms. Enter through a classic brick facade enhanced with modern detailing, settin...
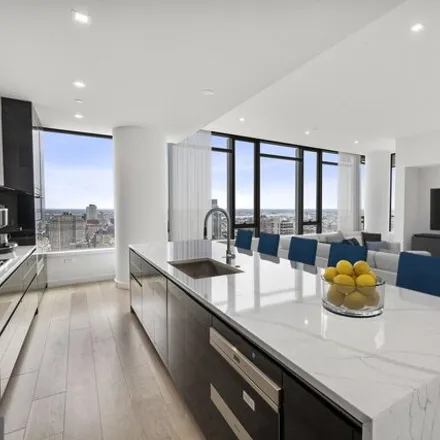
$8,46M
$8,46M
Available: Right Now
Welcome to The Laurel. Named for Pennsylvania s state flower, The Laurel introduces a lifestyle worthy of this final residential opportunity on prestigious Rittenhouse Square. With hotel-like amenities included for all owners, we offer the carefree e...
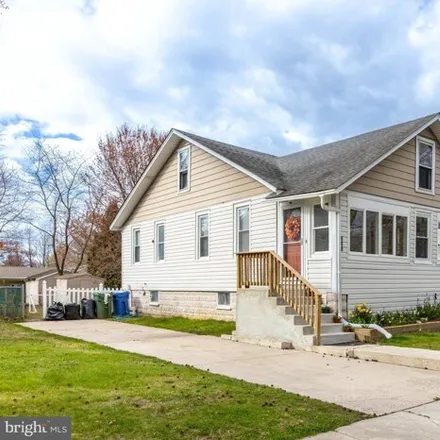
$369,900
$369,900
Available: Right Now
OpenHouse this Sunday, April21, 2024from 12pm - 2pm Super charming bungalow on a quiet street in Cherry Hill West is ready for the next lovely owners to occupy. If you are looking for a nice home in Cherry Hill, this is it. There is no need to wait f...
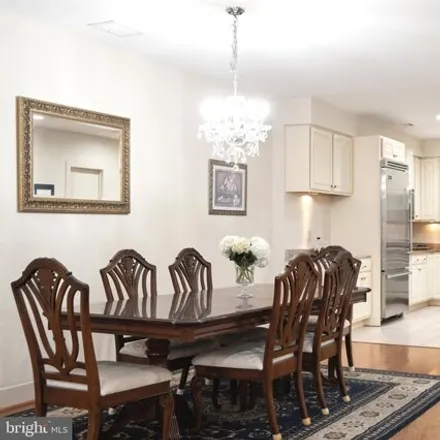
$900,000
$900,000
Available: Right Now
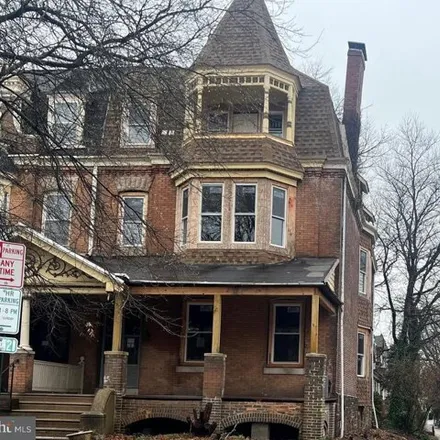
Presenting a rare opportunity to own a residence of timeless sophistication, this classic yet artistically infused home is a gem seldom found in the Philadelphia real estate market. Nestled on a tree-lined street reminiscent of scenes from vintage fi...
$188,900
$188,900
Available: Right Now
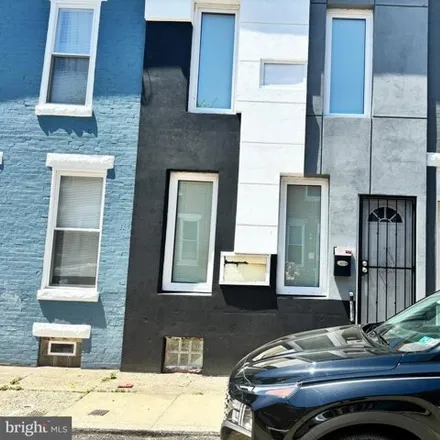
When you arrive at the property you'll notice that it is a beautifully appointed row home 1, 103sq. ft. at Granite St. As you enter this lovely home, you will immediately notice the excellent condition of the laminated floors on both the first and se...
$309,000
$309,000
Available: Right Now
Location location ! This spacious, 3rd floor, 1BD/1BAcondo is perfectly located in the rear of the building overlooking Hancock street. This prime location offers owners the best of Society Hill and Queen Village! Upon entering, you are welcom...
$350,000
$350,000
Available: Right Now
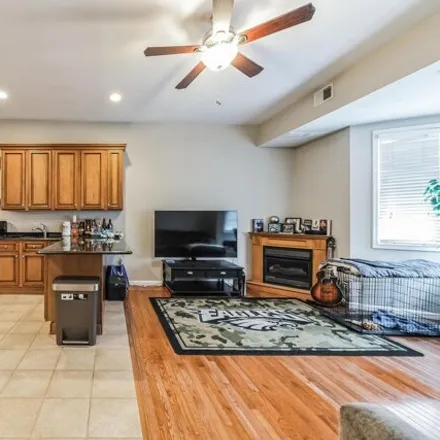
Buyer's financing fell through - so we are back on the market! Welcome to your new home! This spacious 3-bedroom, 2-full bath residence is a perfect blend of comfort, style, and convenience. As you step inside, you'll be greeted by open concept livin...
$400,000
$400,000
Available: Right Now
Stunning Modern Condo with Parking! Welcome to The Residences at Otto! With new development popping up on every corner, 5 years left on tax abatement, deeded parking, private balcony, roof deck with spectacular skyline views; this condo will be every...
$965,000
$965,000
Available: Right Now
Welcome to 23 S 23rd Street Unit 4A, located in the prestigious 23 Condominium building! This expansive, 2 bedroom, 2 bath + DEN, open concept layout features the most magnificent entryway and almost3, 000sq ft all on one level. Highlights of this lu...
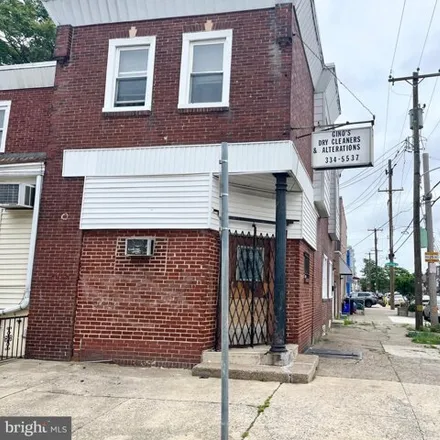
$250,000
$250,000
Available: Right Now
This commercial building has endless possibilities, with two apartments and a commercial space. Stepping inside, one is greeted by the echoes of craftsmanship and tradition that have permeated its walls for years. Once the bustling hub of the tailor ...
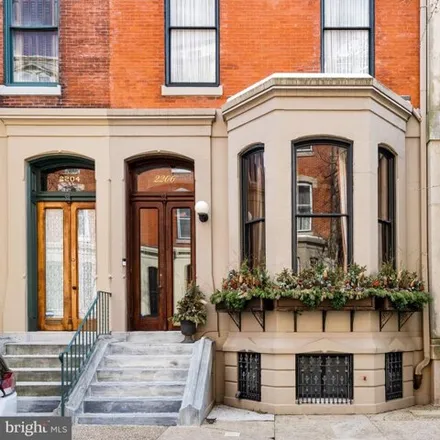
$2,15M
$2,15M
Available: Right Now
Welcome to 2206 Delancey Place - An exquisite 20 ft wide townhouse nestled on a quiet tree-lined street, steps from Fitler Square park. This meticulously crafted residence with 2 private outdoor spaces spans4000 SFacross 4 levels allowing for spaciou...

$375,000
$375,000
Available: Right Now
Welcome to 139 Ebenezer Avenue located in the Belmont Hills section of Bala Cynwyd in Lower Merion Township. You get two units in one! This is a 3 Bedroom and 2 Full Bath Single Family Home with the lower level that has a separate entrance converted ...

$239,000
$239,000
Available: Right Now
This is a rare find owner-sell and owner-maintained fully renovated house in the Olney neighborhood! Dont miss out on this startup home opportunity in Northeast Philly. The location is convenient for all users! Surrounded by the popular Ziehler Playg...
$189,900
$189,900
Available: Right Now
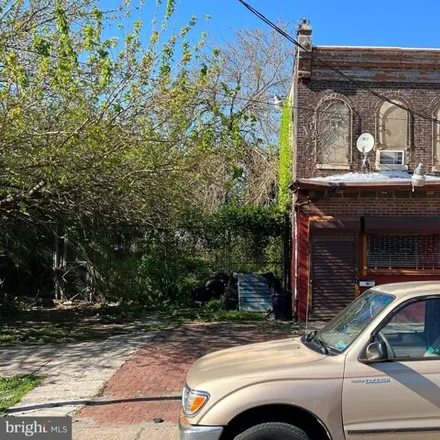
Prime Location on a main artery! SALE includes building plus 2 lots; total land square footage is46 X 103and Acre is 0.11. Great investment property in fast turning Philadelphia. Location is everything...minutes from Temple University, Center City, T...

$585,000
$585,000
Available: Right Now
Lucrative Investment Opportunity: Remodeled Commercial Property in Prime Location. Are you an investor seeking to diversify your portfolio with a high-yielding, cash-flowing property? Look no further than this exceptional commercial building in the v...

$395,000
$395,000
Available: Right Now
Welcome to this solid, income-producing, mixed-use corner quadraplex including 2-car garage. A legal quadraplex with three rental licenses and a barber shop in the commercial space (3 residential + 1 commercial units), it is currently set up as four ...
$89,990
$89,990
Available: Right Now
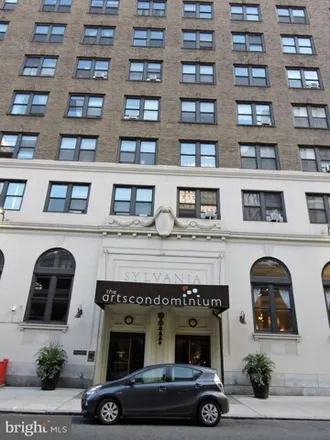
Bright studio at the Arts Condominium -- situated just off of Center City East and the Avenue of the Arts. Located across from the Academy of Music, the Arts Condominium features: a grand lobby, a fitness center, on-site laundry facility, 24/7 lobby ...

$250,000
$250,000
Available: Right Now
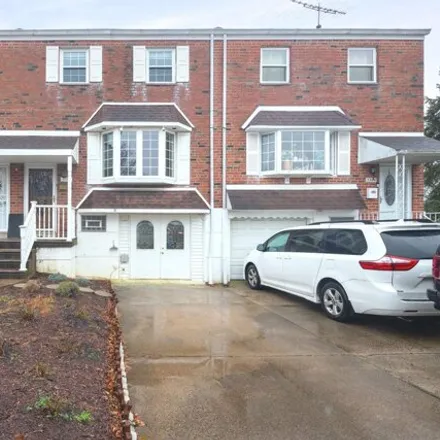
Welcome to 6723 Egret Place, Philadelphia, PA! This charming 3-bedroom, 2-bathroom home nestled in a peaceful neighborhood offers comfort and convenience. As you step inside, you're greeted by an inviting living room featuring large windows that fill...
$1,5M
$1,5M
Available: Right Now
Step right up, folks, and feast your eyes on the epitome of mid-century inspired modern marvels! Introducing Rodger's Row where dreams come true in the most stylish way imaginable! This ain't just a house; it's a symphony of design, blending chic 195...
$400,000
$400,000
Available: Right Now
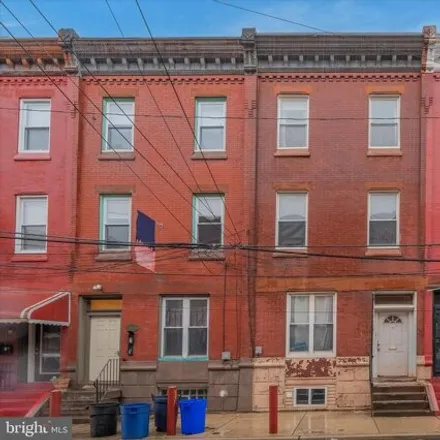
Welcome home to this recently renovated 6 bedroom, 3 bathroom townhome located steps away from Temple University AND has central air conditioning! Live in the home yourself or rent it to Temple students with ease. The living room is spacious, bright,...
$575,000
$575,000
Available: Right Now
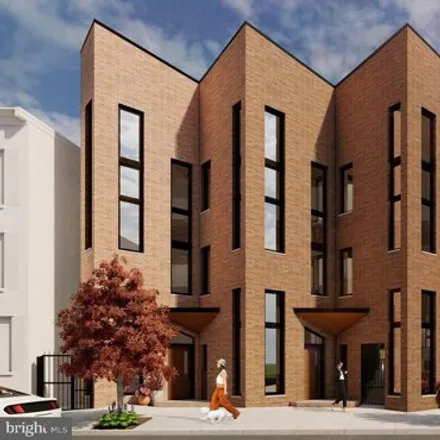
Welcome to this modern 2-bed, 2-bath stately townhome at 842 North 19th Street, Unit A, in the vibrant Fairmount neighborhood. This corner property boasts a 1-car attached garage (inside access) and city views. No condo fees here. With a newer roof, ...
Philadelphia
According to statistics, the population in Philadelphia, PA amounts to 1,584,138, which shows decline 0% compared to the previous year. The median age of the city’s residents is 35. The average household income is $46,116, shifting growth 16% from the past year, and the average property value in Philadelphia, PA decline 1% to $167,700 throughout the year.
| Population | 2M |
| Median Age | 34.5 |
| Poverty Rate | 26% |
| Household Income | $46,116 |
| Number Of Employees | 714,190 |
| Median Property Value | $167,700 |
What is the Average Price of Apartments for Sale in Philadelphia, PA?
| Month | Median Price |
|---|---|
| Jun 2024 |
$279,172
|
| May 2024 |
$338,992
|
| Apr 2024 |
$311,029
|
| Mar 2024 |
$311,029
|
| Feb 2024 |
$311,029
|
| Jan 2024 |
$311,029
|
| Month | Median Price |
|---|---|
| Jun 2024 |
$334,032
|
| May 2024 |
$337,850
|
| Apr 2024 |
$346,404
|
| Mar 2024 |
$305,597
|
| Feb 2024 |
$305,597
|
| Jan 2024 |
$305,597
|
Household Income
The average household income in Philadelphia, PA grew from $39,759 to $46,116 in the past year. This data is an estimate based upon 608,233 households in Philadelphia, PA . The chart below presents how household income is distributed in Philadelphia, PA in comparison to the revenue allocation amid households nationally.
Property Value
According to data from last year, the average property value in Philadelphia, PA shifted from $166,200 to $167,700 throughout the year. The subsequent graph indicates the share of properties in the given price range in Philadelphia, PA in comparison to the median property value in the same price segment across the country. According to the data, the greatest share of Philadelphia, PA properties falls in the '$200,000 to $249,999' range, which is lower than the most significant median property across the country.
Rent vs. Own
Property Taxes
One of the most important aspects for property owners is the amount of property taxes. This graph shows distribution of property taxes in Philadelphia, PA compared to median property taxes around the country. The prevalent amount of property taxes in Philadelphia, PA equals $1150, which is less than the national average.