Pittsburgh, PA, USA apartments for sale
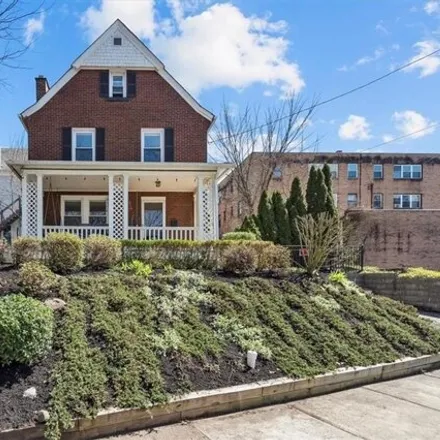
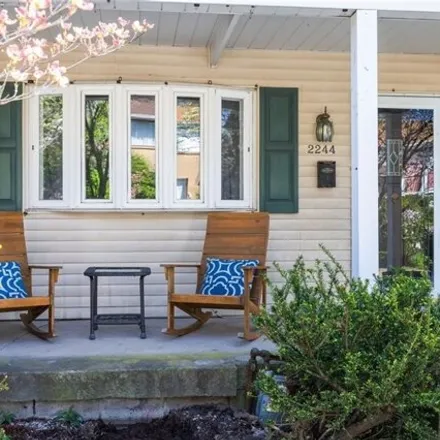
$369,900
$369,900
Available: Right Now
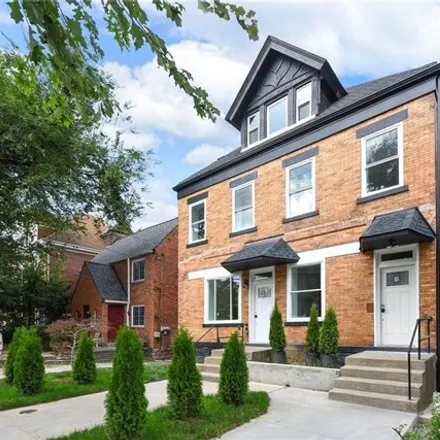
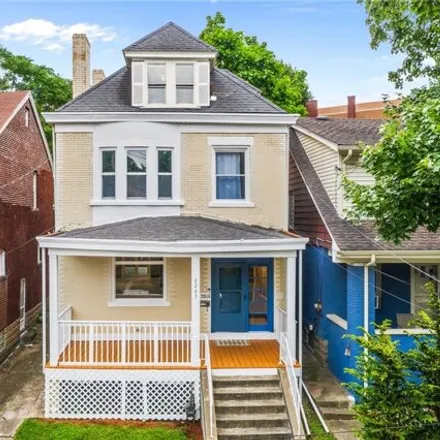
Welcome to this charming 4-bedroom, 2-bathroom residence in Edgewood! The first floor has a great flow coming in from the inviting front porch; a nice size living room that opens into the large dining room and then into the stylish kitchen featuring ...
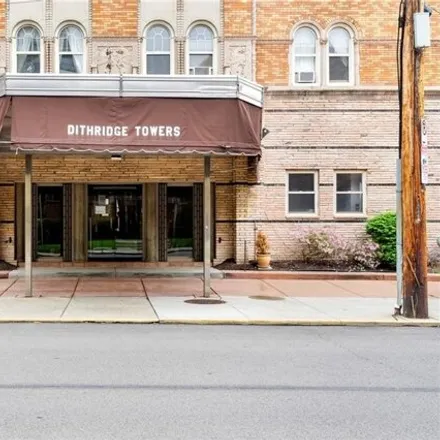
$194,900
$194,900
Available: Right Now
Introducing a spacious one-bedroom corner condo nestled in the vibrant heart of Oakland. Recently refreshed painted, this unit boasts an updated bathroom, and stunning Parquet hardwood floors throughout. Sunlight pours in from the south-facing window...
$299,000
$299,000
Available: Right Now
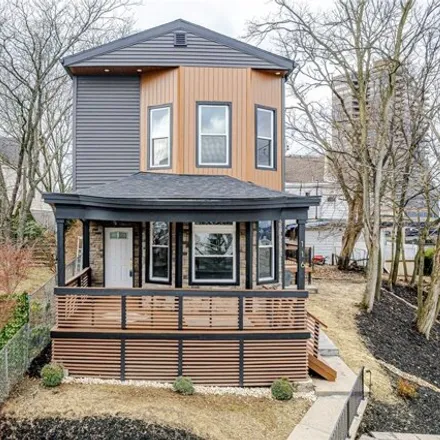
This stunning property has undergone a complete transformation, boasting modern luxury and timeless charm. Step inside to discover a multi-level, spacious and inviting home, adorned with brand new LVP flooring that exudes elegance and durability. Nat...
$89,000
$89,000
Available: Right Now
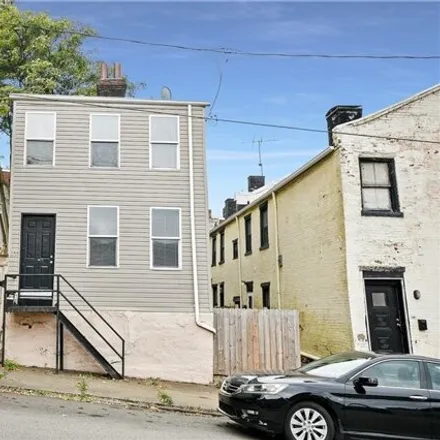
Embrace the opportunity to shape your home with this mostly-prepped canvas, ready for investors and those seeking to personalize their space! Sprawling living room with laminate floors. The dining room awaits your design expertise and finishing. The ...
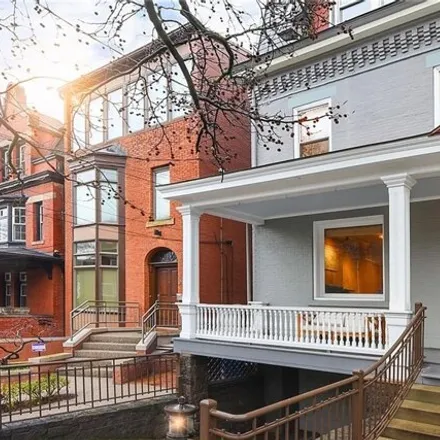
$995,000
$995,000
Available: Right Now
Amazing West Shadyside location and contemporary sophistication are yours when you make this unique residence your new home! Featured in HouseTrends Magazine following extensive renovation (2009) by architect Roy Penner, it boasts a 3-story interior ...
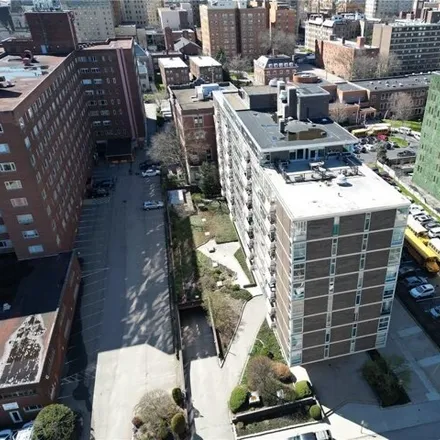
$288,800
$288,800
Available: Right Now
Enjoy the ultimate convenience with easy access to CMU, University of Pittsburgh, and renowned hospitals, making it an ideal spot!Embrace the warmth of natural light streaming through huge new windows, illuminating the spacious 9th-floor unit, creati...
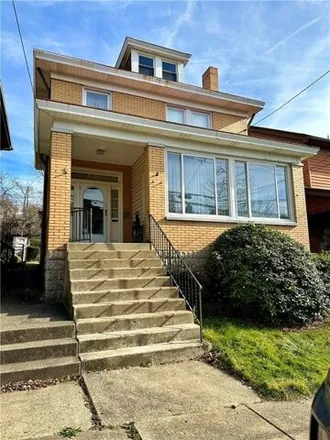
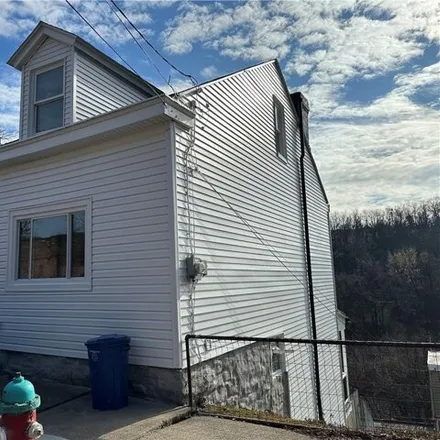
$294,000
$294,000
Available: Right Now
Welcome to 209 Olympia Avenue in the desired Duquesne Heights! This solid home has some great bones with hardwood preserved under the carpets on the main and upper level. The sunroom off of the living room is the perfect spot for a home office with g...
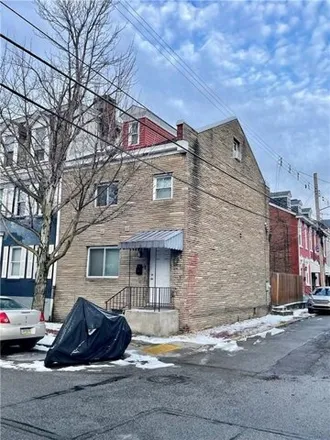
$279,000
$279,000
Available: Right Now
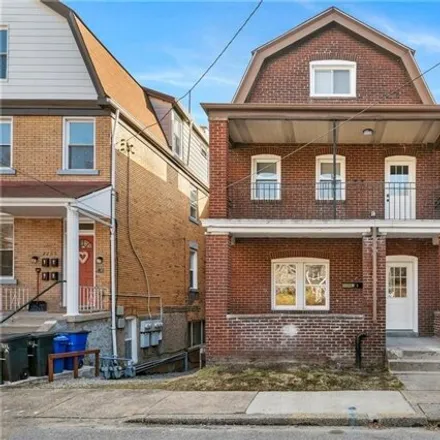
Unlock the potential of this remarkable Brick South Side Flats Row Home, on a Corner Lot, currently tenant-occupied till July, and offering an Excellent Investment Opportunity. This charming Residence combines classic architectural elements with mode...
$189,000
$189,000
Available: Right Now
Great location for walkability to South Side attractions yet tucked away on quiet street and nice area in South Side. Work in the city, easy commute or walk to city across the 10th St. bridge. Spacious and neutral throughout. Main floor has updated k...
$549,000
$549,000
Available: Right Now
Fantastic Owner Occupant or Investment Opportunity! Fully renovated Up/Down Duplex in the heart of Squirrel Hill!!! A very rare find! Main Floor Unit 1: Living, Dining, Kitchen, Bath, Bedroom. Upper Floors Unit 2: Floor 2 has Living, Dining, Kitchen,...
$636,000
$636,000
Available: Right Now
With sweeping, breathtaking views of Pittsburgh, this Stunning and Immaculate home has been completely remodeled from top to bottom. Greeting you is composite, covered front porch that welcomes you into the formal entry with marble tile. To your righ...
$1,08M
$1,08M
Available: Right Now
Beautiful, top to bottom renovation in the most convenient location! Solid, brick multi-unit building! High ceilings, lots of natural lights. Everything is brand new: roof, gutters, downspouts, framing, drywall, 3 HV/ACunits, 3 tankless water heaters...
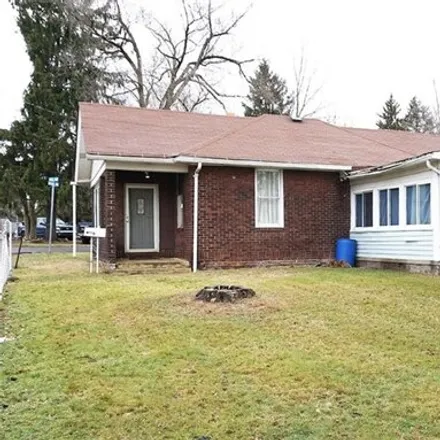
$239,900
$239,900
Available: Right Now
Wonderfully renovated 3 Bedroom, 2 Full bath home ~ Located on a lovely, quiet, tree-lined street ~ Just 10 minutes to downtown! Extra-large, fenced in lot is one of the many attributes of this property. A covered porch is another feature thats sure ...
$250,000
$250,000
Available: Right Now
Must See- Solid brick Up/Down 2 Unit building conveniently located in the heart of Polish Hill! Perfect for an investor looking for a great cash flow and value add opportunity. Put forth the effort to rehab the units and achieve prime market rents. A...
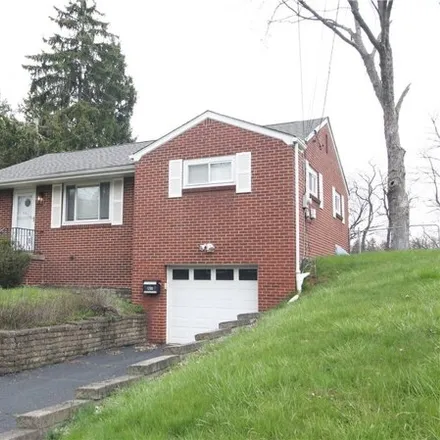
$275,000
$275,000
Available: Right Now
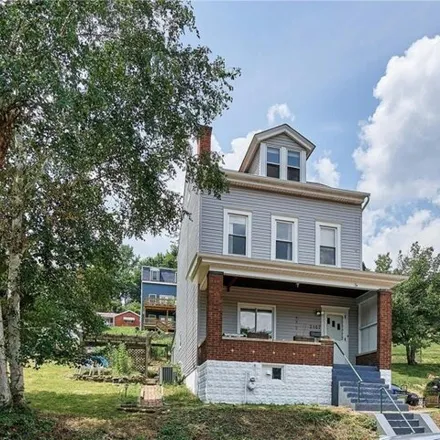
Welcome to 308 Conroy Drive! Nestled in Greentree, this charming home combines the convenience of a comfortable and stylish living experience, amazing view, with easy access to both the vibrant city of Pittsburgh and Pittsburgh International Airport....
$549,000
$549,000
Available: Right Now
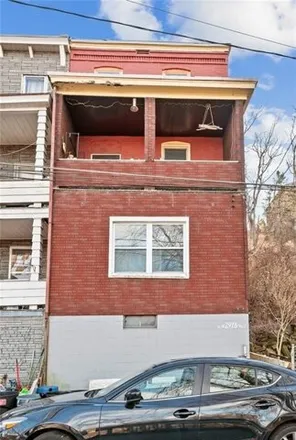
Prime Location! Located In Squirrel Hill Close to All of Pittsburghs Hospitals and Universities! Modern Amenities Including Smart Ring Camera, Nest Thermostat, Lock, and Stove. Five Over Sized Bedrooms, One Full Bath! High Ceilings, Spacious Open Flo...
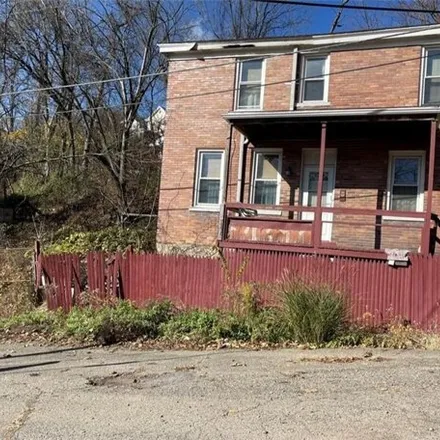
$115,000
$115,000
Available: Right Now
Welcome to 8 Marne Way, a charming two-story brick home on an expansive double corner lot in the heart of Mt. Washington. Calling all investors, this property is your canvas for opportunity! Featuring two bedrooms and a full bath, Marne Way offers a ...
$225,000
$225,000
Available: Right Now
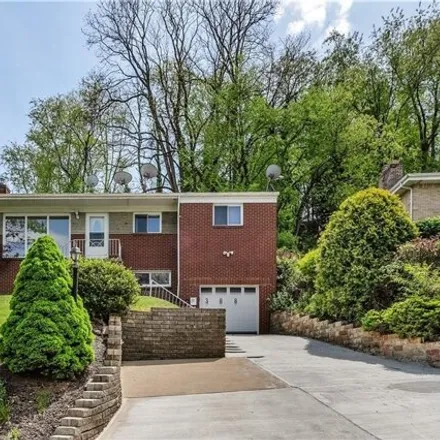
Location, location, location! Minutes from downtown, but in a quaint Green Tree neighborhood! Super solid 2 bedroom 1.5 bath home. Beautiful Hardwood and laminate floor through out! Huge fenced in yard. Awesome rear and side deck connects easily to t...
$149,900
$149,900
Available: Right Now
Nicely maintained home, spacious living room, dining room, sunkissed kitchen with huge deck! 2nd floor has 2 bedroom with a newly installed full bathroom. Lower level has bedroom/game room and large bathroom with jet tub and standing shower stall. La...
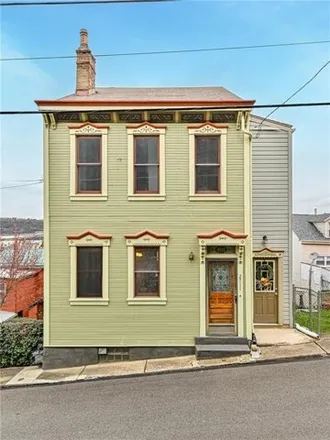
$425,000
$425,000
Available: Right Now
Breathtaking City Views from your new dream home nestled on the South Side Slopes. This meticulously maintained 1897 Italiate residence offers a perfect blend of historic charm and modern amenities boasting over 1950+ sq ft of living space. 3 Bedroom...
$269,000
$269,000
Available: Right Now
Welcome to our new listing located 5 minutes away from downtown. Enjoy the passive cash flow of both units or keep one rented and live in the other. Both units were recently renovated with all new flooring throughout both apartments new cabinets and ...
$269,900
$269,900
Available: Right Now
Well maintained 2 story Colonial, fully rented, features three bedrooms and 1.5 bathrooms, large kitchen, and dining room, cozy covered porch off living room, large basement and 1 car garage. Attractive neutral dcor, wall to wall carpet, hardwood flo...
Pittsburgh
According to statistics, the population in Pittsburgh, PA amounts to 301,038, which shows decline 0% compared to the previous year. The median age of the city’s residents is 34. The average household income is $47,417, shifting growth 3% from the past year, and the average property value in Pittsburgh, PA growth 13% to $140,200 throughout the year.
| Population | 301,038 |
| Median Age | 34 |
| Poverty Rate | 22% |
| Household Income | $47,417 |
| Number Of Employees | 157,610 |
| Median Property Value | $140,200 |
What is the Average Price of Apartments for Sale in Pittsburgh, PA?
| Month | Median Price |
|---|---|
| Apr 2024 |
$228,530
|
| Mar 2024 |
$228,530
|
| Feb 2024 |
$228,530
|
| Jan 2024 |
$228,530
|
| Dec 2023 |
$244,451
|
| Nov 2023 |
$273,053
|
| Month | Median Price |
|---|---|
| Apr 2024 |
$357,297
|
| Mar 2024 |
$370,483
|
| Feb 2024 |
$370,483
|
| Jan 2024 |
$370,483
|
| Dec 2023 |
$280,572
|
| Nov 2023 |
$309,358
|
Household Income
The average household income in Pittsburgh, PA grew from $45,851 to $47,417 in the past year. This data is an estimate based upon 141,881 households in Pittsburgh, PA . The chart below presents how household income is distributed in Pittsburgh, PA in comparison to the revenue allocation amid households nationally.
Property Value
According to data from last year, the average property value in Pittsburgh, PA shifted from $123,600 to $140,200 throughout the year. The subsequent graph indicates the share of properties in the given price range in Pittsburgh, PA in comparison to the median property value in the same price segment across the country. According to the data, the greatest share of Pittsburgh, PA properties falls in the '$100,000 to $124,999' range, which is lower than the most significant median property across the country.
Rent vs. Own
Property Taxes
One of the most important aspects for property owners is the amount of property taxes. This graph shows distribution of property taxes in Pittsburgh, PA compared to median property taxes around the country. The prevalent amount of property taxes in Pittsburgh, PA equals $1150, which is less than the national average.