Red Wing, MN, USA apartments for sale
$335,000
$335,000
Available: Right Now
Lovely end unit townhome in a quaint and quiet neighborhood on a cul-de-sac. Open floor plan with a bright sunroom. Home has many recent updates including new Quartz counter tops in the kitchen. New luxury vinyl flooring throughout the entire home. C...
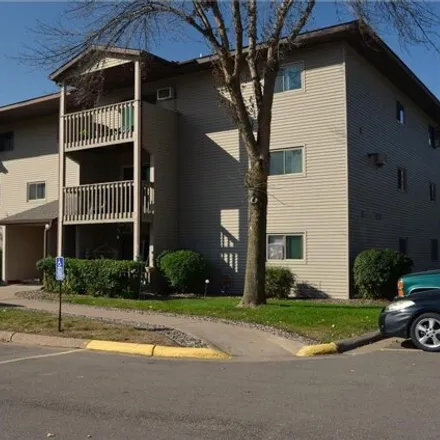
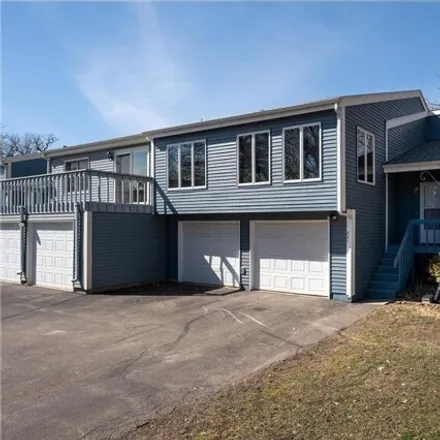
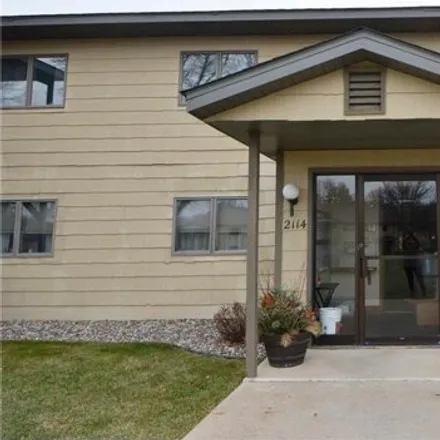
$149,850
$149,850
Available: Right Now
A rare opportunity to own a conveniently-located unit on the main level! It features a lovely covered patio, an open floor plan and Owners bedroom with a walk-in closet. An energy-efficient unit with zoned heat. Youll appreciate the nearby location o...
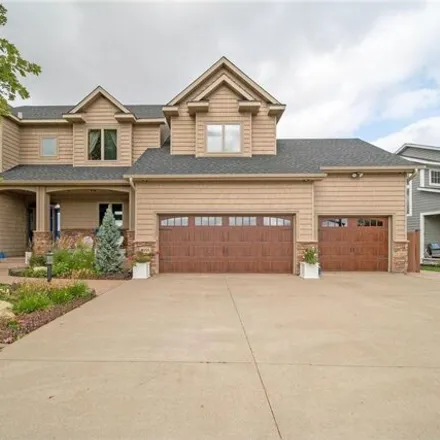
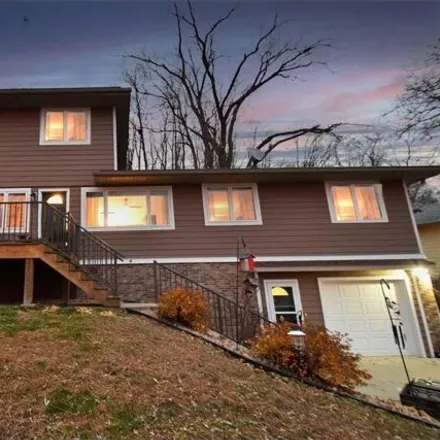
$499,000
$499,000
Available: Right Now
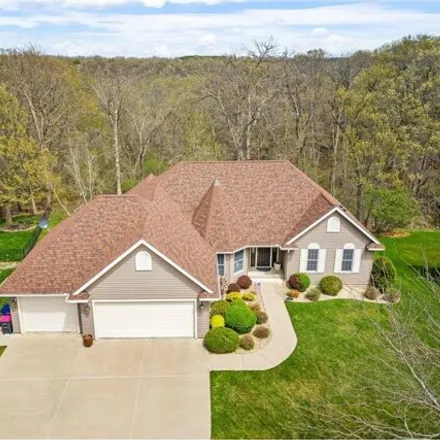
This amazing one owner, smoke/pet free property is a must see! Boasting of beautiful solid maple woodwork and doors, granite counters, SS appliances, center island/rollout drawers, owners suite with walk-in closet and private bath, 2nd bedroom and la...
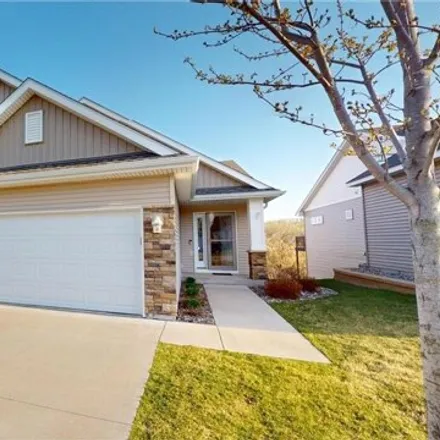
$259,000
$259,000
Available: Right Now
Welcome home to 1418 Central Avenue, in the heart of Red Wing. Close to schools, parks, and downtown, this newly renovated home features: a brand new kitchen including: stainless steel appliances, cabinets and vinyl flooring, fully renovated main flo...
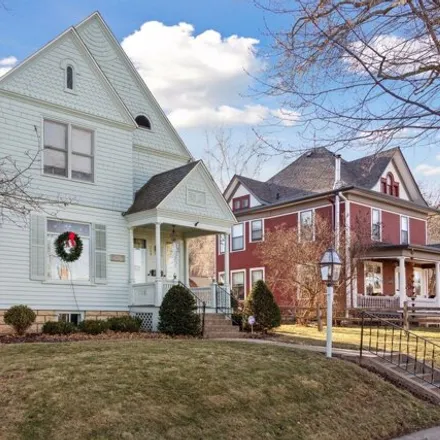
$379,900
$379,900
Available: Right Now
Indulge in the extraordinary with this captivating Queen Anne residence, situated in downtown Red Wing, cherished by a single family since its inception in 1889. Immaculately preserved, this historic gem unveils a rare opportunity for versatile livin...
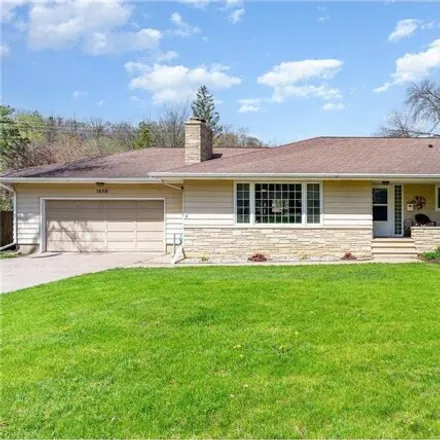
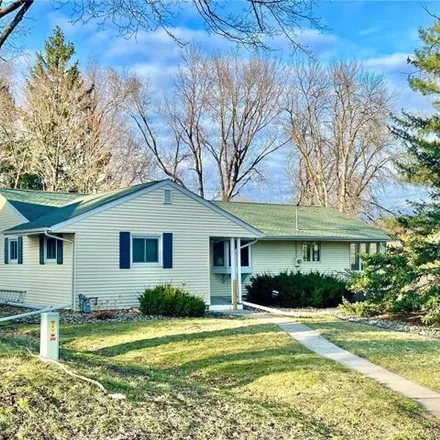
$285,000
$285,000
Available: Right Now
Nestled conveniently close to schools, 1808 Twin Bluff Road presents an enticing opportunity for those seeking both comfort and convenience. This charming rambler-style home boasts 3 bedrooms and 2 baths. Step inside to discover Cherry Hardwood Floor...

$345,000
$345,000
Available: Right Now
Nestled in the heart of Red Wing, this 3 bed, 3 bath home exudes timeless character and charm. Situated on a spacious corner lot, the property includes a private back patio perfect for outdoor relaxation, while a quaint balcony offers the perfect spo...
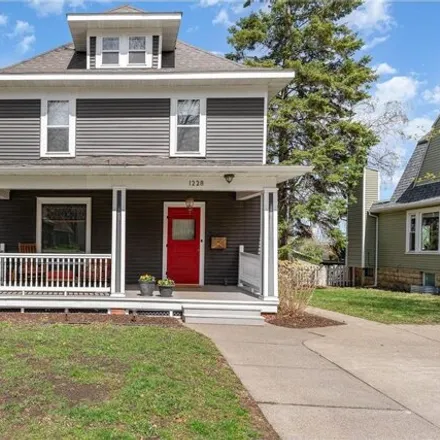
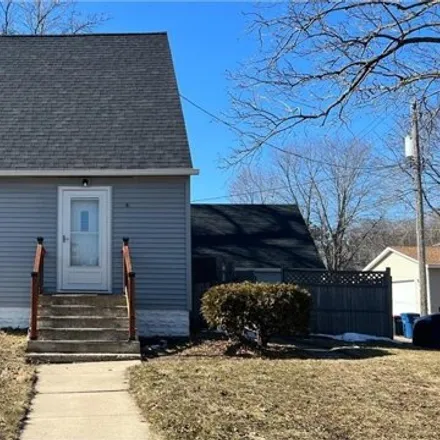
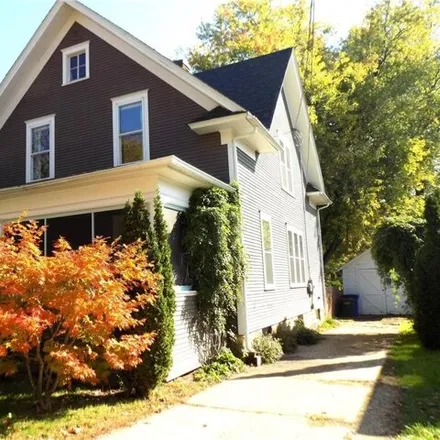
$300,000
$300,000
Available: Right Now
Step into this timeless charming 4-bedroom, 2-bathroom home. Nestled close to downtown, this 2030-square-foot abode welcomes you with a sprawling front porch. Inside, discover gleaming hardwood floors, built-ins, exquisite natural woodwork, and breat...
$275,000
$275,000
Available: Right Now
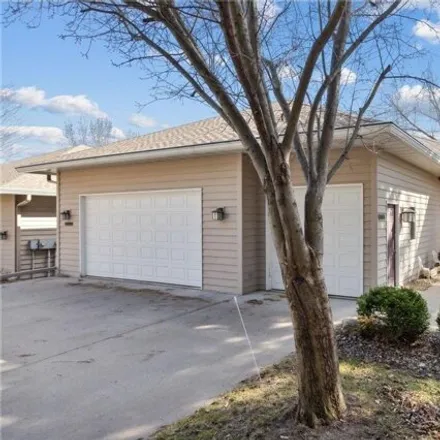
Welcome to this meticulously maintained end-unit townhome located at 158 Sargent Drive! This inviting residence boasts two nice-sized bedrooms and two bathrooms. Enjoy the ease of one-level living complemented by a cozy gas fireplace and stainless st...
$599,000
$599,000
Available: Right Now
Welcome to this custom designed spacious home on Chalet Court! With scenic bluff top views of rolling farm fields, a vineyard, and tree lined ridge. This home has many luxury features that set it apart from the rest! The kitchen features plenty of ca...
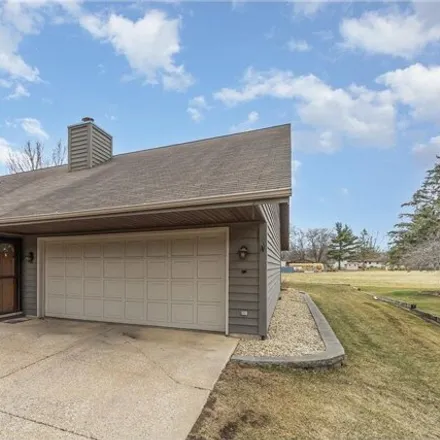
$240,000
$240,000
Available: Right Now
Experience the comfort of your next home. A cozy end-unit townhome surrounded by mature trees and a spacious yard. The main level is modern and inviting with an open concept design, effortlessly connecting the kitchen, living room, informal dining an...
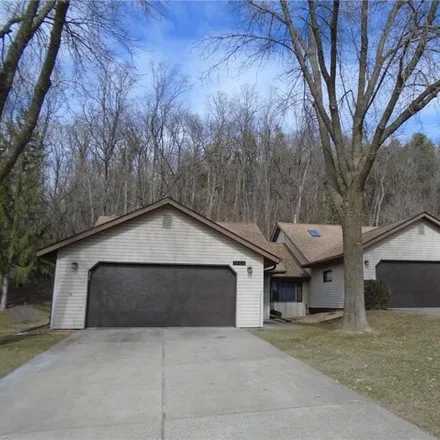
$329,000
$329,000
Available: Right Now
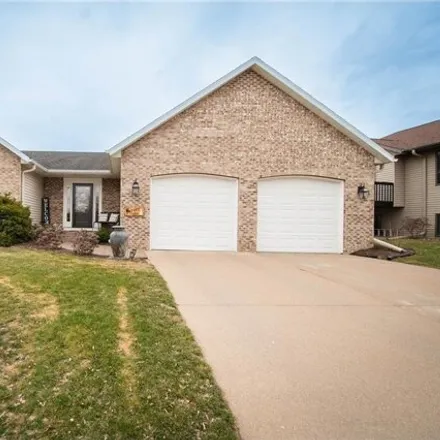
Immaculate, open and sunny floor plan with numerous living spaces, 4 BRs, 2 bathrooms and a large heated two car garage. Fantastic sunroom addition invites you right in with bluff and valley views and gorgeous sunrises...you will never want to leave!...
$310,000
$310,000
Available: Right Now
Welcome! This beautiful home offers a screened in front porch and an Arctic entry. Once in side you will enjoy the spacious foyer and All the original charm and character can be seen. Each room offers spacious rooms for your family to enjoy. The bedr...
$450,000
$450,000
Available: Right Now
This one-level walk-out townhome offers a blend of luxury and tranquility, perfectly positioned in a secluded location, overlooking the 18th tee of the Red Wing Golf Course. The layout ensures ample space and privacy for residents and guests. The int...

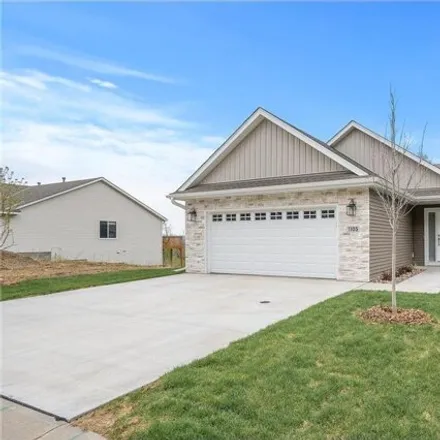
$380,690
$380,690
Available: Right Now
The Riverdale features 1580 square feet of one level, open concept living including 2 bedrooms/2 bathrooms, sunroom, patio, vaulted ceilings, birch cabinetry with soft close doors and drawers, quartz countertops, stainless steel appliance package, pa...
$199,900
$199,900
Available: Right Now
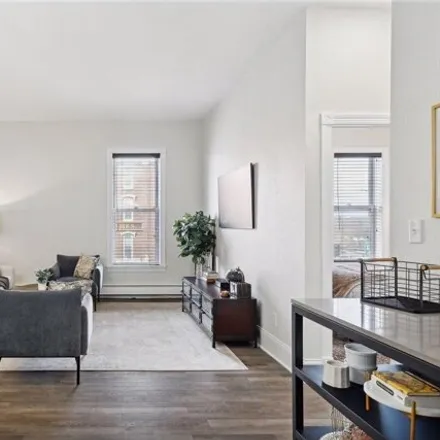
Welcome home to your renovated, River Valley retreat! Enjoy this beautiful, 2 bed/2 bath condo located on the top floor, facing the historic St James Hotel and the Mississippi River. Conveniently located just steps from everything the historic downto...
$559,900
$559,900
Available: Right Now
Welcome to this executive rambler boasting 4 beds, 3 baths, and a 3-car garage. As you arrive, be captivated by the beautiful landscaping. Inside, the main level impresses with a grand entryway, formal dining, hardwood flooring, and a spacious laundr...
$389,900
$389,900
Available: Right Now
4-bedroom 2-bathroom home in a great location, private back yard and quiet street! Roomy kitchen/dining area boasts vaulted ceilings, ample cupboard space, updated flooring. In the main living room area, you will enjoy the gas fireplace and trayed ce...
$146,500
$146,500
Available: Right Now
This spacious second floor condo has been meticulously cared for and nicely updated. Open Living/Dining/Kitchen, Two large bedrooms, walk-in primary closet, recently updated bathroom w/granite countertop and vinyl flooring. Enjoy your covered balcony...
$429,900
$429,900
Available: Right Now
Tired of the high interest rates? This property has the possibility for the new owner to assume the current mortgage with the interest rate of 4.625%. This could be your opportunity to own an amazing updated, move-in ready, spacious 4 bedroom/3 bath ...
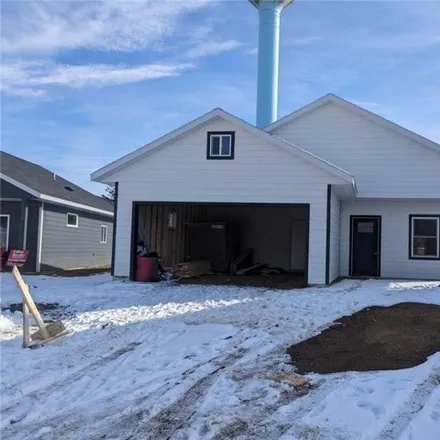
$359,900
$359,900
Available: Right Now
Home under construction. Available6-30-2024.Exceptional floor plan, all living facilities main floor primary bedroom w/private bath and walk-in closet. 9 foot ceilings, sunny open floor plan w/stainless, quartz countertops, large dining w/attached su...
$501,889
$501,889
Available: Right Now
The Bridgeport Sr. features 1513 square feet of one level, open concept living including 3 bedrooms/3 bathrooms, sunroom, patio, vaulted ceilings, birch cabinetry with soft close doors and drawers, quartz countertops, stainless steel appliance packag...
Red Wing
According to statistics, the population in Red Wing, MN amounts to 16,334, which shows decline -1% compared to the previous year. The median age of the city’s residents is 42. The average household income is $50,746, shifting growth 3% from the past year, and the average property value in Red Wing, MN growth 3% to $163,200 throughout the year.
| Population | 16,334 |
| Median Age | 41.6 |
| Poverty Rate | 16% |
| Household Income | $50,746 |
| Number Of Employees | 7,595 |
| Median Property Value | $163,200 |
What is the Average Price of Apartments for Sale in Red Wing, MN?
| Month | Median Price |
|---|---|
| Apr 2024 |
$373,927
|
| Mar 2024 |
$373,927
|
| Feb 2024 |
$373,927
|
| Jan 2024 |
$373,927
|
| Dec 2023 |
$359,730
|
| Nov 2023 |
$318,756
|
Household Income
The average household income in Red Wing, MN grew from $49,236 to $50,746 in the past year. This data is an estimate based upon 6,975 households in Red Wing, MN . The chart below presents how household income is distributed in Red Wing, MN in comparison to the revenue allocation amid households nationally.
Property Value
According to data from last year, the average property value in Red Wing, MN shifted from $158,000 to $163,200 throughout the year. The subsequent graph indicates the share of properties in the given price range in Red Wing, MN in comparison to the median property value in the same price segment across the country. According to the data, the greatest share of Red Wing, MN properties falls in the '$150,000 to $174,999' range, which is lower than the most significant median property across the country.
Rent vs. Own
Property Taxes
One of the most important aspects for property owners is the amount of property taxes. This graph shows distribution of property taxes in Red Wing, MN compared to median property taxes around the country. The prevalent amount of property taxes in Red Wing, MN equals $1150, which is less than the national average.