Seattle, WA, USA apartments for sale
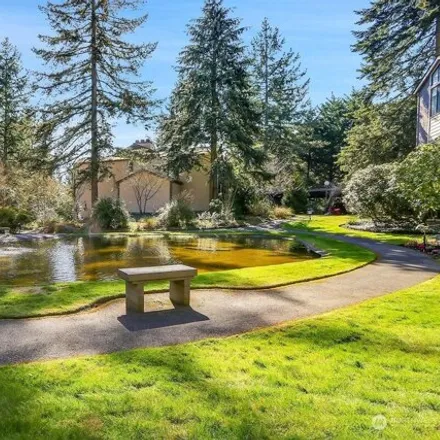
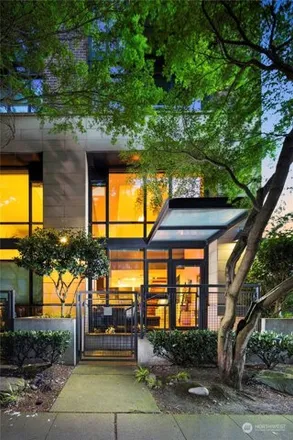
$599,500
$599,500
Available: Right Now
Seldom comes the opportunity to live within 6.7-ac. gated park-like privacy in Seattle, under a canopy of towering arbor; winding paths, ponds, Nature. Immense, casual privacy. Step through a wall of windows onto a 4-seasons deck. Over1, 550-sfSINGLE...
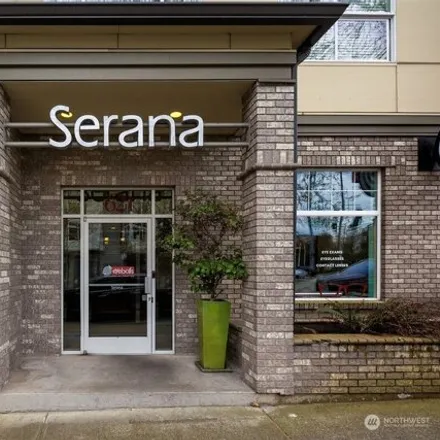
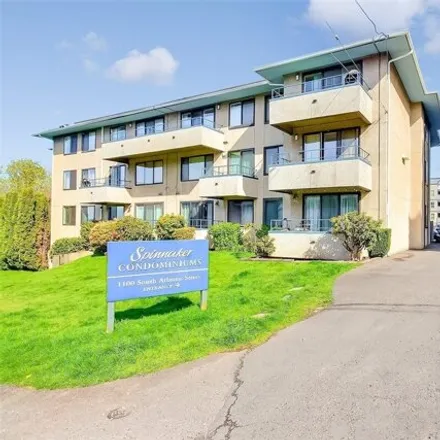
$399,500
$399,500
Available: Right Now
This perfectly located lower Queen Anne condo is the urban abode you have been seeking! Live life to the fullest in heart of shopping and dining in the shadow of the Space Needle. The entire city is at your feet with pubs, the opera/ballet, Orange Th...
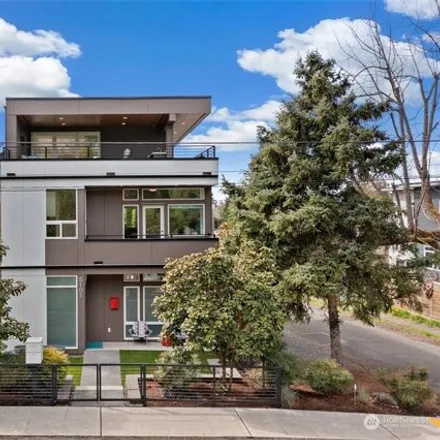
$1,65M
$1,65M
Available: Right Now
This is a seriously nice house! Beautiful, high-end home just mile from The Junction! Entertain effortlessly with your choice - a beautiful outdoor kitchen, or step inside and enjoy the chefs delight complete with a commercial-grade wine fridge, wet ...
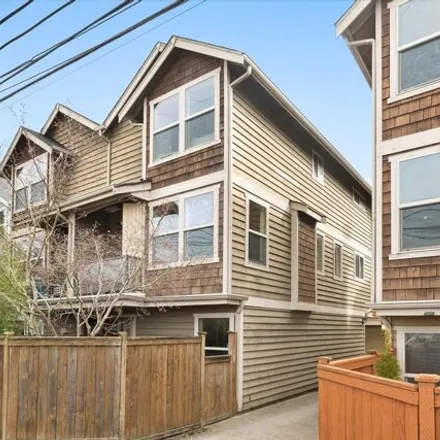
$549,000
$549,000
Available: Right Now
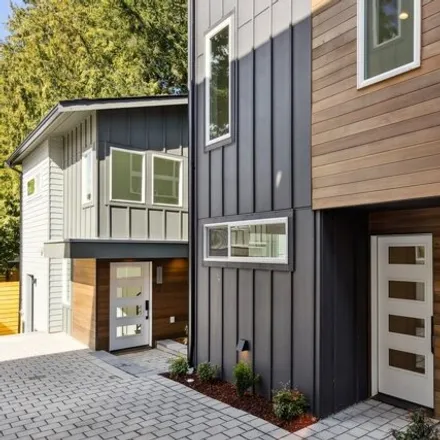
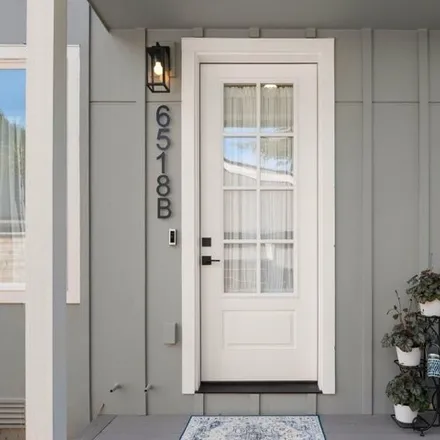
A stylish TownHome with NO homeowner dues and a private Garage and full fenced backyard. 3 bedroom 2.5 bath homes with Olympic mountain views and set up off the street level for privacy and light. New carpet, new LVP flooring, freshly painted inside!...
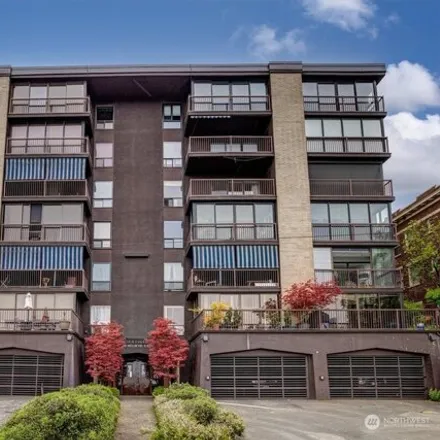
$675,000
$675,000
Available: Right Now
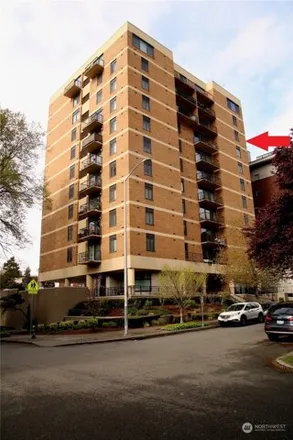
Great location when you live at The Gallery! Amazing, turnkey primary bedroom + non-conforming 2nd bedroom pied-a-terre (comes fully furnished) situated at the north end of Belltown and Lower Queen Anne. This large, open concept live/work loft end un...
$420,000
$420,000
Available: Right Now
Discover your dream home in Seattle's serene Beacon Hill neighborhood! This elegant2BR, 1-3/4bath single-level condominium is a gem, boasting fresh updates including new carpet, modern appliances, and a vibrant paint job. Nestled in a tranquil settin...
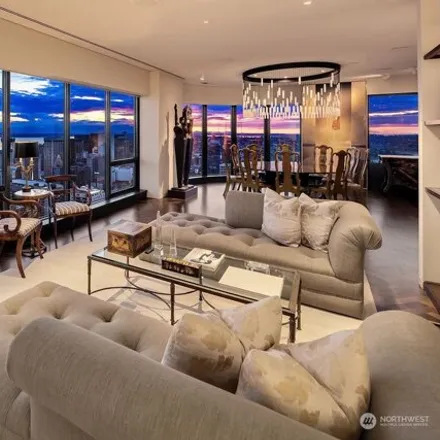
$9,88M
$9,88M
Available: Right Now
A once in a generation opportunity to own the entire Penthouse floor in one of Seattle's most luxurious condominium buildings offering an unparalleled level of service and amenities including an indoor pool and outdoor tennis court. The full-floor re...
$624,900
$624,900
Available: Right Now
Picture yourself gazing at the iconic Space Needle as the sun sets from the comfort of your new condo's living room. This gorgeously renovated modern home boasts a generous floor plan adorned with sleek tile flooring. This west-facing unit has abunda...
$799,950
$799,950
Available: Right Now
Welcome to View Ridge Villas a lovely new project in the heart of NE Seattle. View Ridge Villas is located on a quiet side street with views of Sand Point Country Club golf course and conveniently located close to University Village, UW, Magnuson Par...
$1,18M
$1,18M
Available: Right Now
Centrally located on a picturesque street-to-street lot, this tastefully updated Bryant home offers comfort and convenience. Move-in ready, featuring a bright, light-filled living + dining area w/vaulted ceilings and west-facing deck, overlooking the...
$425,000
$425,000
Available: Right Now
VIEW! Fantastic location and best price/value in the area! Two bedrooms and two FULL baths, one attached to Primary bedroom. Lots of light, upgraded electrical, ultra-modern windows and slider, this home awaits your personal touches as you build equi...
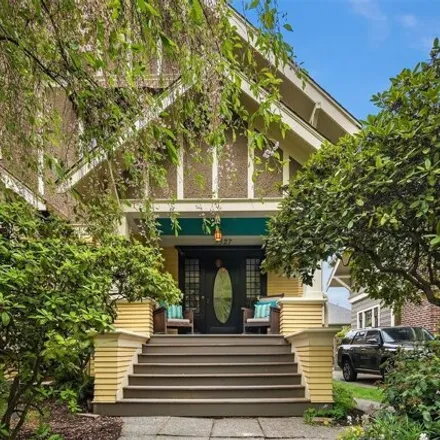
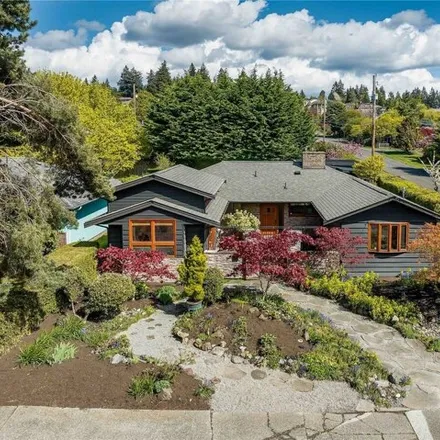
$699,000
$699,000
Available: Right Now
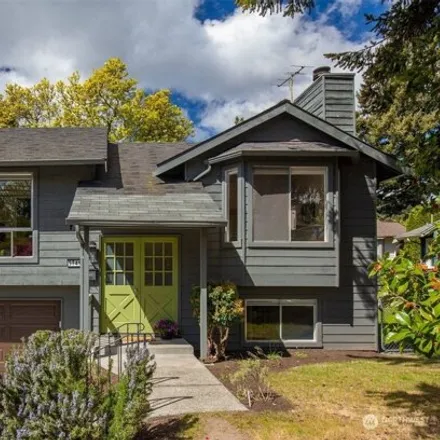
Charming bungalow in the heart of West Seattle. Very sweet, move-in ready, 3 bedroom + 2 bath home. Cute street appeal with covered walk up. Dripping with character, hardwood floors, and built-ins throughout. Perfect kitchen with new cabinets, counte...
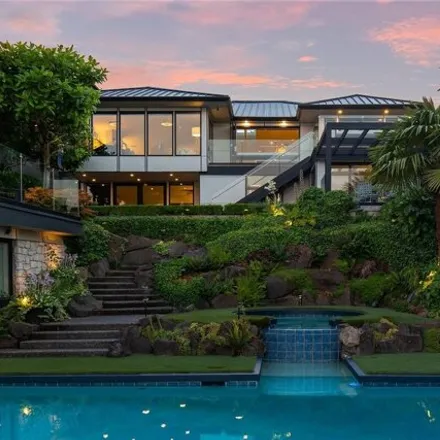
$8,65M
$8,65M
Available: Right Now
Exceptional lakeside retreat artfully blends modern Palm Springs with the elegance of vintage Hollywood Hills. Perfectly situated on the shores of Lake Washington, this sophisticated mid century home was comprehensively reimagined and renovated in 20...
$1,35M
$1,35M
Available: Right Now
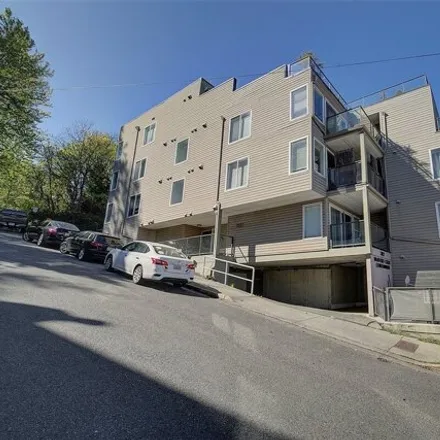
Come live in this captivating modern townhome on the North Slope of Queen Anne Hill. Mesmerizing view on each level w/ Light Filled Open Spaces, Sleek Designer Finishes, Master En-Suite, Entertainers Kitchen. Main living quarter encompasses an open-c...
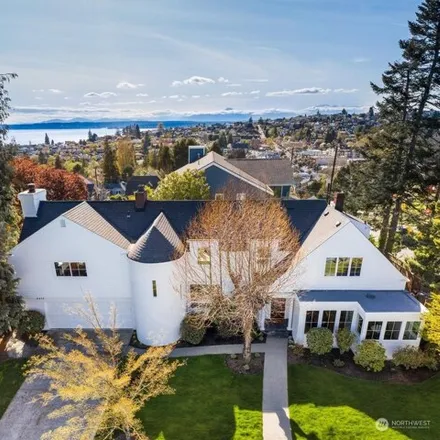
$2,78M
$2,78M
Available: Right Now
This stunning Magnolia home seamlessly blends classic design w/ an art deco flair. Offering uncompromising quality and elegance, main floor bed and bath, sleek open-concept kitchen and dining room, custom cabinetry, designer light fixtures and luxury...

$580,000
$580,000
Available: Right Now
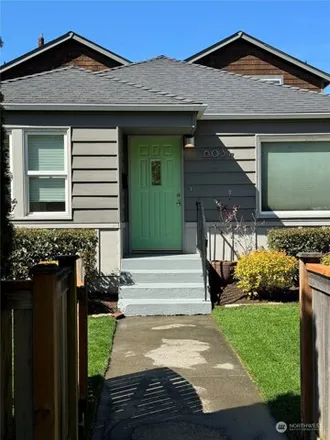
The perfect place to call your new home in the heart of Vibrant Seattle Central District. Spacious, beautifully appointed two story 2 bd, 1.5 ba home is move in ready. Freshly painted interior, new modern front door, vinyl windows, new sliding glass ...
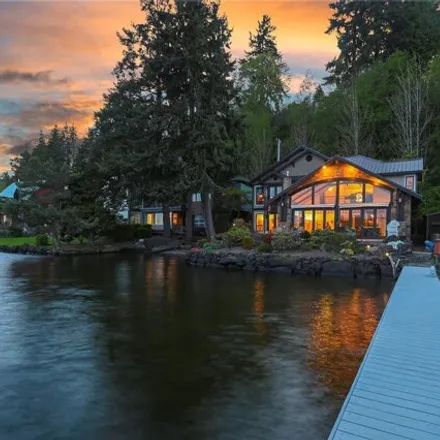
$3,5M
$3,5M
Available: Right Now
Gorgeous lk wa waterfront, nw contemporary 2 story, complete rebuild/remodel in 2014 top to bottom, quality and elegance, finest in material, wood-wrapped doors and Windows, 60ft front footage w/dock.grand entry w/vaulted ceilings, custom b...
$1,68M
$1,68M
Available: Right Now
Prepare to be dazzled by this lovingly restored craftsman on Hunter Boulevard! As you enter a gorgeous front door and wainscoting set the stage. The spacious entryway flows into a living room with lighted built-ins, fireplace, and cozy window nooks. ...
$755,000
$755,000
Available: Right Now
Experience the best of West Seattle living in this 2-story modern cottage nestled in Gatewood, just moments to dining, shopping, and Rapid Ride at Morgan Junction. Enjoy abundant natural light, high ceilings, and rare 8 doors lending an airy elegance...
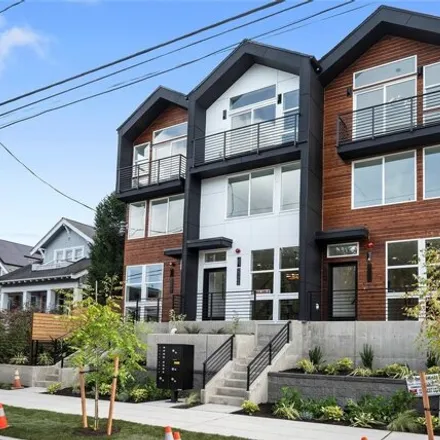
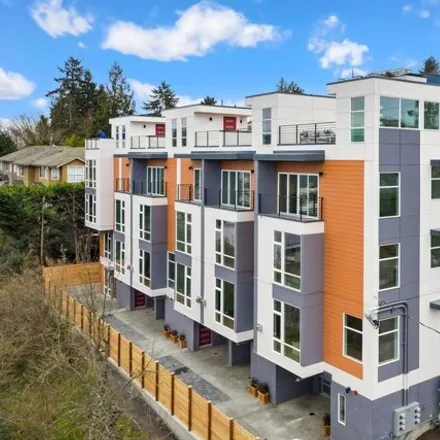
$1,04M
$1,04M
Available: Right Now
Nestled in Seattle's Eastlake neighborhood, Greenway introduces six beautifully crafted townhomes. These luxury residences boast superior construction quality, open-concept kitchens with top-of-the-line appliances, primary suites with spa-like ensuit...
$319,950
$319,950
Available: Right Now
You can live within a short distance to Alki Beach and an easy jaunt to Downtown Seattle! This wonderful 1BR condo with serene views of the Greenbelt from your private patio. This one is ready to move right in! Newer gorgeous countertops, Open Kitche...
$1,2M
$1,2M
Available: Right Now
Discover the epitome of one-level living in this stylish residence situated on a level corner lot in the desirable Broadview.The thoughtfully designed layout features a gourmet kitchen equipped with a Wolf 5-burner cooktop and ample countertop space,...
Seattle
According to statistics, the population in Seattle, WA amounts to 744,949, which shows growth 3% compared to the previous year. The median age of the city’s residents is 35. The average household income is $93,481, shifting growth 8% from the past year, and the average property value in Seattle, WA growth 13% to $758,200 throughout the year.
| Population | 744,949 |
| Median Age | 35.2 |
| Poverty Rate | 12% |
| Household Income | $93,481 |
| Number Of Employees | 451,954 |
| Median Property Value | $758,200 |
Household Income
The average household income in Seattle, WA grew from $86,822 to $93,481 in the past year. This data is an estimate based upon 338,002 households in Seattle, WA . The chart below presents how household income is distributed in Seattle, WA in comparison to the revenue allocation amid households nationally.
Property Value
According to data from last year, the average property value in Seattle, WA shifted from $673,100 to $758,200 throughout the year. The subsequent graph indicates the share of properties in the given price range in Seattle, WA in comparison to the median property value in the same price segment across the country. According to the data, the greatest share of Seattle, WA properties falls in the 'n/a' range, which is lower than the most significant median property across the country.
Rent vs. Own
Property Taxes
One of the most important aspects for property owners is the amount of property taxes. This graph shows distribution of property taxes in Seattle, WA compared to median property taxes around the country. The prevalent amount of property taxes in Seattle, WA equals $3000, which is less than the national average.