Shelbyville, TN, USA apartments for sale

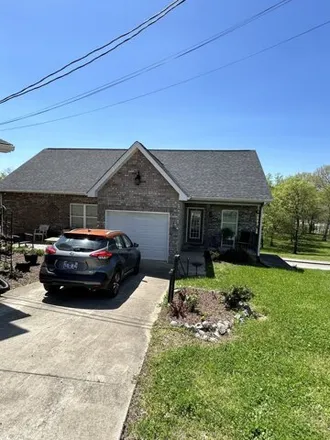
$239,900
$239,900
Available: Right Now
This charming 3 bedroom, 2 bath home is located in a well-established neighborhood near the renowned Celebration horseshow grounds. With its adorable appeal, it is an ideal choice for those seeking a starter home or a potential income property. The p...
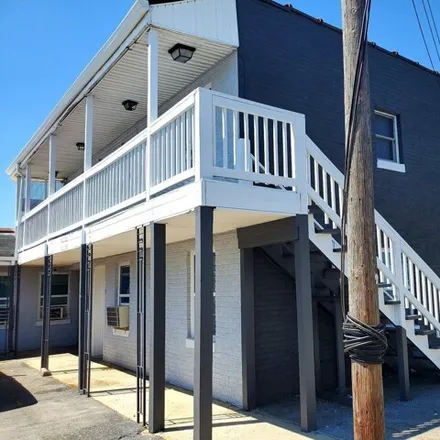
$200,000
$200,000
Available: Right Now
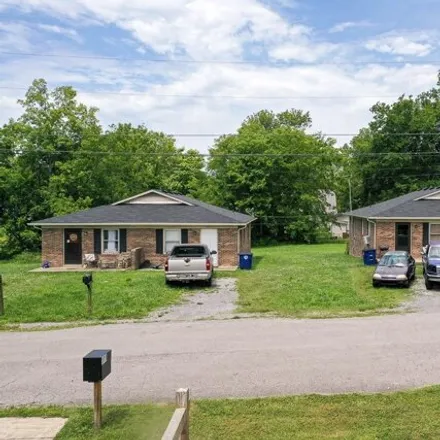
Calling all investors !!!!! Lucrative investment opportunity in Shelbyville, Tennessee!! Unlock the potential of this exceptional investment opportunity with two separate duplexes, available for$200, 000each ($400.000for both). Located ...

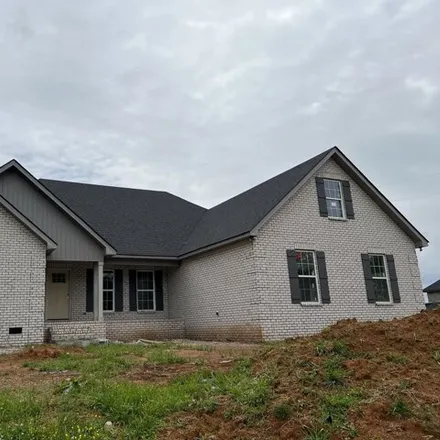
$331,990
$331,990
Available: Right Now
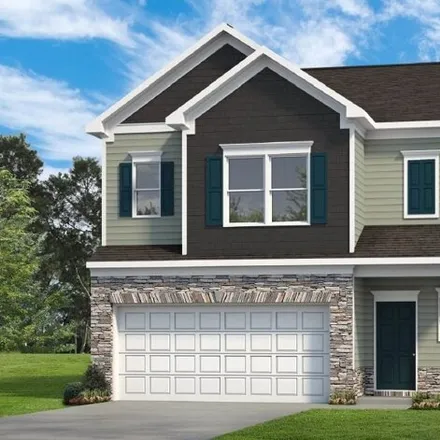
Plan(1726 Elevation ABC) Welcome to a residence that encapsulates modern comfort and style within. The great room awaits, inviting you to unwind and create memories in a setting designed for both relaxation and entertainment. Seamlessly flowing into ...

$580,000
$580,000
Available: Right Now
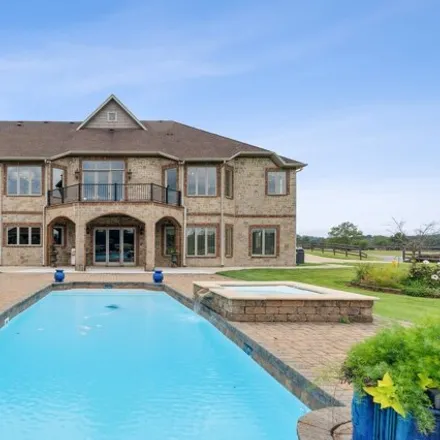
Stunning Mid Century Modern Showplace! Brand New Everything ! Single Level Living! New Roof, New HVAC, New Siding and Gutters, New Appliances, New Cabinets and New Marble/Granite Countertops, New Vanities, New Lighted Mirrors, New Flooring, Ne...

$310,000
$310,000
Available: Right Now
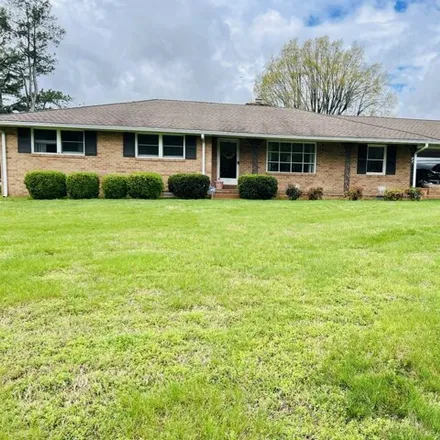
Discover this recently renovated suburban retreat in the heart of Shelbyville offering1, 723sq ft of modern living space. With 2 primary suites downstairs and 2 additional bedrooms upstairs, 3 full baths, get ready to call this home! Come sit and enj...

$575,000
$575,000
Available: Right Now
Welcome to this charming home on 5.5 acres in Shelbyville, TN that offers a serene setting with natural privacy all around. This home gives the appearance of a log home w/newly treated log siding. Enjoy the peaceful surroundings from the full-length ...

$299,900
$299,900
Available: Right Now
Welcome home to this totally renovated Move in ready home. This home has new floors, new carpet, fresh paint, update curb appeal, and much more! The spacious primary bedroom features a walk in closet and a full bathroom. All appliances include...
$1,88M
$1,88M
Available: Right Now
This exquisite custom-built one owner home is truly a one of a kind! Situated on 6.98 acres of land, this 4 bedroom, 4 full baths and 3 half baths home has over5, 900square feet and is sure to impress. With so much privacy enjoy watching the abundant...

$348,990
$348,990
Available: Right Now
Plan(1989 Elevation ABC) sample photos Welcome to a true modern living, where a meticulously designed home seamlessly blends comfort, style, and functionality. This home exudes sophistication from its upgraded exterior elevation to its thoughtfully a...

$439,000
$439,000
Available: Right Now
This all brick3brd/2bath home in the desirable Union Station Subdivision offers a single-story layout with over2, 100sqft of living space. The spacious foyer leads to the great room and kitchen, creating an open and inviting atmosphere. The kitchen f...

$254,900
$254,900
Available: Right Now
Welcome home to this 3 bed 2 bath home located in a quiet cul-de-sac. This home has been totally remodeled, featuring; new flooring in the living room, kitchen, and hallway; new carpet in all 3 bedrooms, fresh paint throughout, inviting curb appeal a...

$319,900
$319,900
Available: Right Now
Welcome home to this better-than-new, single-level living home in a great Shelbyville neighborhood. With an open-concept living area, large bedrooms, tons of closet space, granite countertops, upgraded lighting and ceiling fans throughout, and a cove...
$349,900
$349,900
Available: Right Now
The Braselton II at Global Manor by Smith Douglas lot # 95 has a rear corner covered patio, directly accessible from the light-filled family room. A large eat-in island kitchen featuring granite countertops and stainless steel appliances overlooks th...

$320,990
$320,990
Available: Right Now
Plan(1615 Elevation ABC) sample photos Welcome to this exquisite home, where styled features and thoughtful design converge to create an unparalleled living experience. As you step through the front door into the private entry foyer, you're greeted w...

$323,900
$323,900
Available: Right Now
Wonderful 4BR unit in a gated community. LVP flooring throughout the main living area, two story great room, primary suite on the main floor. Kitchen includes granite counters and all wood cabinets w/ soft close hinges. All BR's include spacious walk...
$389,900
$389,900
Available: Right Now
Welcome to 1019 Union Street. This one level home has so much to offer. Featuring 3 bedrooms and 3 full bathrooms. 2 different sitting rooms. One featuring a beautiful fireplace and beautiful wood beams throughout the ceiling. Beautiful hallway leadi...

$599,900
$599,900
Available: Right Now
Custom built home in Great Neighborhood features crown molding, hardwoods, tile, spacious master bedroom/bath, great room with fireplace and cathedral ceiling, separate dining room, bonus room, huge utility room, all seasons room, pergola and attache...
$319,000
$319,000
Available: Right Now
Introducing our stunning 2 bedroom, 2.5 bath townhouse, boasting a picturesque location surrounded by scenic walking trails and offering breathtaking views of Flat Creek. Inside, you'll find a large walk-in closet, providing ample storage space for y...
$575,000
$575,000
Available: Right Now
Great investment! Cash- Flow property. Welcome to an exceptional opportunity in the world of commercial real estate! Presenting a income-producing property that's sure to catch your discerning eye. This remarkable listing boasts 10 fully occupied uni...
$609,900
$609,900
Available: Right Now
Beautiful New Construction Home on 5.20 Acres! Seller offering$10, 000in closing cost assistance. This 3 bedroom 2 bathroom home offers luxury finishes including quartz countertops in kitchen and bathrooms, soft close cabinets, upgraded light fixture...

$347,990
$347,990
Available: Right Now
Plan(2073 Elevation ABC) sample photos Step into a world of refined living in this sprawling2, 073sq. ft. home. Enter the living room that rolls into the dining room which is enclosed by glass French doors, adding a touch of privacy while maintaining...

$365,485
$365,485
Available: Right Now
The Caldwell at Global Manor by Smith Douglas is a great choice for those needing a first-floor owner's suite with 3 bedrooms up. The hub of this home is the centrally located family room that's open to the kitchen. Kitchen has stainless steel applia...
Shelbyville
According to statistics, the population in Shelbyville, TN amounts to 21,028, which shows decline 1% compared to the previous year. The median age of the city’s residents is 34. The average household income is $37,995, shifting growth 7% from the past year, and the average property value in Shelbyville, TN growth 5% to $109,100 throughout the year.
| Population | 21,028 |
| Median Age | 34.4 |
| Poverty Rate | 24% |
| Household Income | $37,995 |
| Number Of Employees | 9,278 |
| Median Property Value | $109,100 |
What is the Average Price of Apartments for Sale in Shelbyville, TN?
| Month | Median Price |
|---|---|
| Jun 2024 |
$203,686
|
| May 2024 |
$186,908
|
| Apr 2024 |
$207,407
|
| Mar 2024 |
$207,407
|
| Feb 2024 |
$207,407
|
| Jan 2024 |
$207,407
|
| Month | Median Price |
|---|---|
| Jun 2024 |
$294,722
|
| May 2024 |
$310,176
|
| Apr 2024 |
$298,571
|
| Mar 2024 |
$298,571
|
| Feb 2024 |
$298,571
|
| Jan 2024 |
$298,571
|
Household Income
The average household income in Shelbyville, TN grew from $35,620 to $37,995 in the past year. This data is an estimate based upon 7,497 households in Shelbyville, TN . The chart below presents how household income is distributed in Shelbyville, TN in comparison to the revenue allocation amid households nationally.
Property Value
According to data from last year, the average property value in Shelbyville, TN shifted from $104,200 to $109,100 throughout the year. The subsequent graph indicates the share of properties in the given price range in Shelbyville, TN in comparison to the median property value in the same price segment across the country. According to the data, the greatest share of Shelbyville, TN properties falls in the '$125,000 to $149,999' range, which is lower than the most significant median property across the country.
Rent vs. Own
Property Taxes
One of the most important aspects for property owners is the amount of property taxes. This graph shows distribution of property taxes in Shelbyville, TN compared to median property taxes around the country. The prevalent amount of property taxes in Shelbyville, TN equals $1150, which is less than the national average.