Smyrna, TN, USA apartments for sale
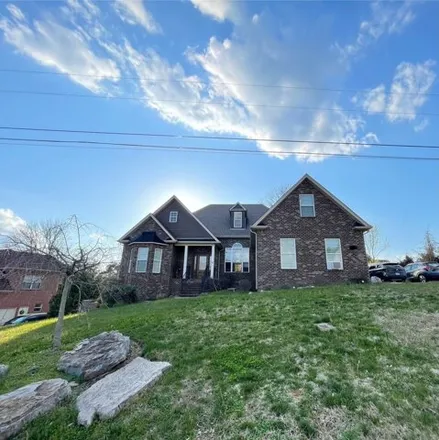
$599,995
$599,995
Available: Right Now
ALL BrickCUSTOMhome with ALL the Bells and Whistles andAMAZINGViews! Open Floor Plan and Soaring Cathedral Ceilings! Kitchen Features Gorgeous Glass Tile Backsplash, Quartz Countertops, Schrock Soft Close Cabinets w/ Pullout Drawers! High End applian...
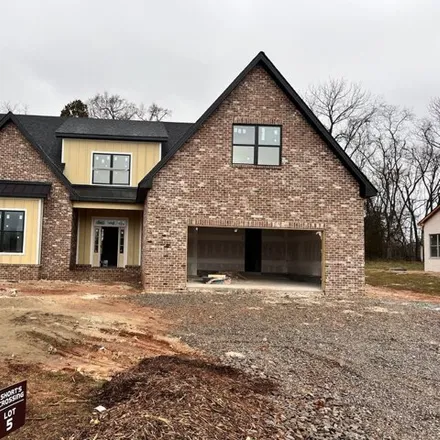
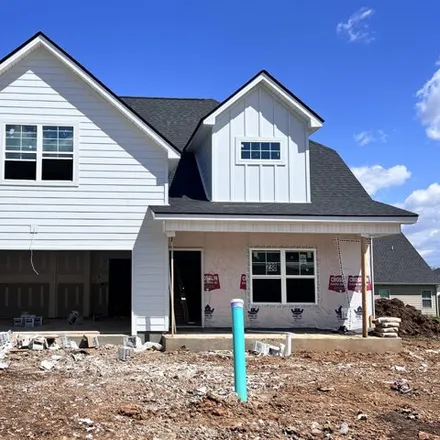
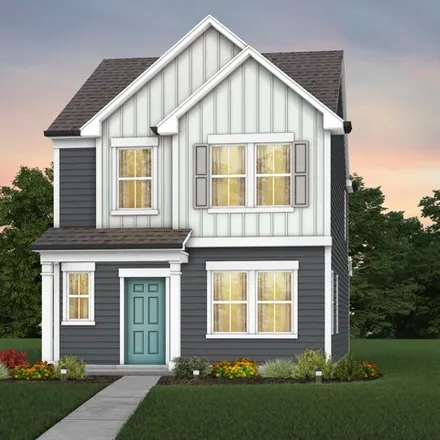
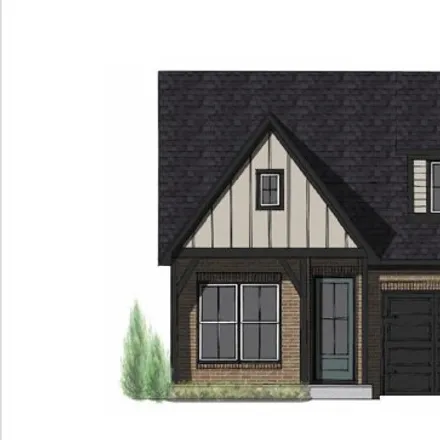
$748,971
$748,971
Available: Right Now
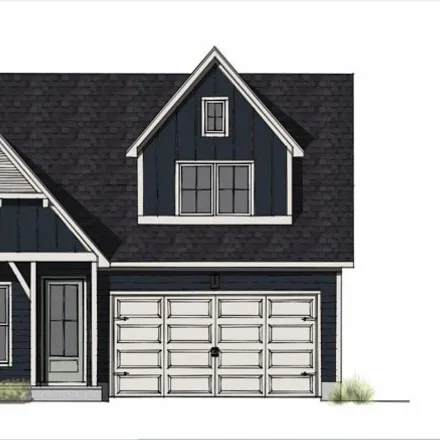
A new community of 25 homes is being developed, bordered by the Corp of Engineers' land. Located on W Jefferson Pike, this area is witnessing significant growth in Smyrna, and this community is set to be the first among many upcoming developments. Th...
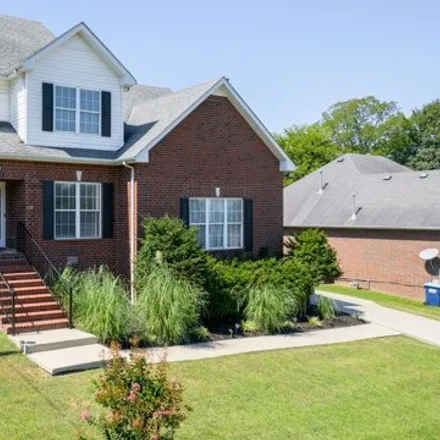
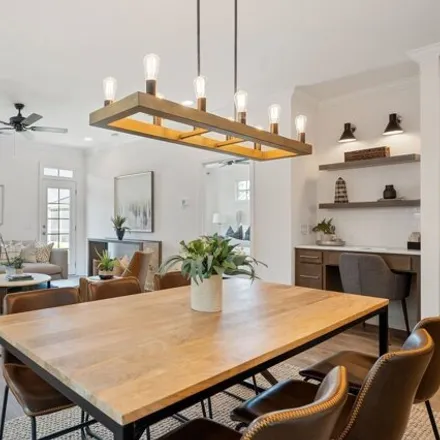
$545,000
$545,000
Available: Right Now
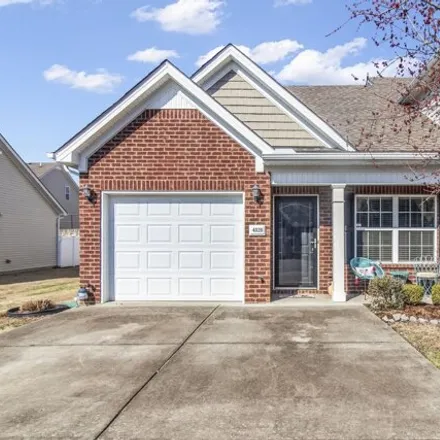
Welcome to this charming home in Cedar Forest! You'll love the functional office space with custom built-in bookshelves, perfect for working from home or studying. The living room is the ideal gathering spot for friends and family, with a cozy gas FP...
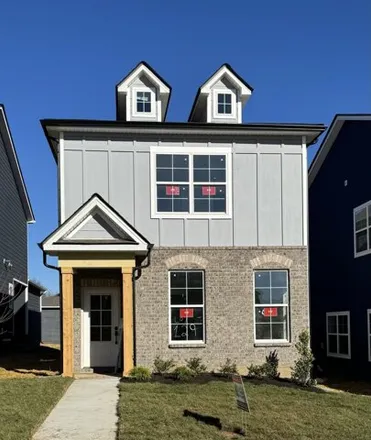
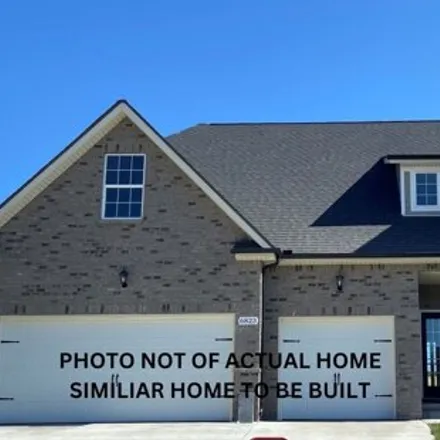
$399,990
$399,990
Available: Right Now
Spacious new construction home qualifies for THDA Financing! Great location! Only 15-20 minutes to Nashville, Nolensville, Murfreesboro. Spacious open concept floor plan with large great room that flows to kitchen with large island, and then into din...
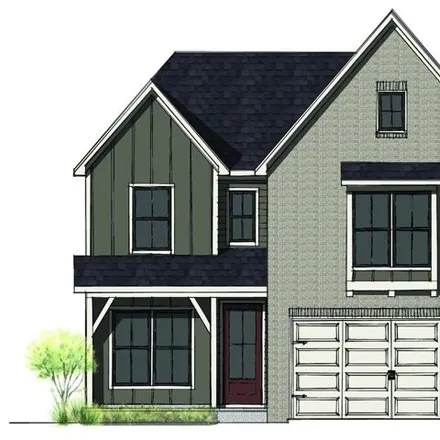
$485,000
$485,000
Available: Right Now
Come see our NEW 4-bedroom, 2.5-bathroom home with modern elegance and comfort. Featuring a main-floor primary bedroom with en-suite bath including a separate shower, garden tub, and double sinks. The sleek kitchen includes granite counters and stain...

$445,900
$445,900
Available: Right Now
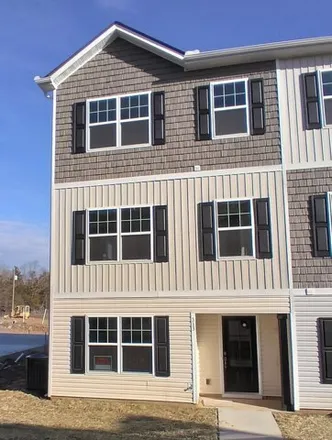
1 Yr. Home Warranty Included! Like New, END UNITTownhome, with Upgrades galore! Primary en-suite on the MAIN floor, which is RARE for the townhome styles. Primary bath features double sinks, quartz countertops, walk in closet, and tiled stand-...
$468,990
$468,990
Available: Right Now
Customize this home and receive$25, 000in flex money! You can use flex money towards both buying the interest rate down and off the price of the home! Tied to use of preferred lender and title. The Beaufain floorplan is an open plan, 3 bedroom with h...
$594,999
$594,999
Available: Right Now
Surrey homes presents another beautiful home. Construction has started. This home is nestled on a cul-de-sac street featuring beautiful views and setting. Foundation has started. Brick front, brick half on sides, rear of home hardie board. Spa...
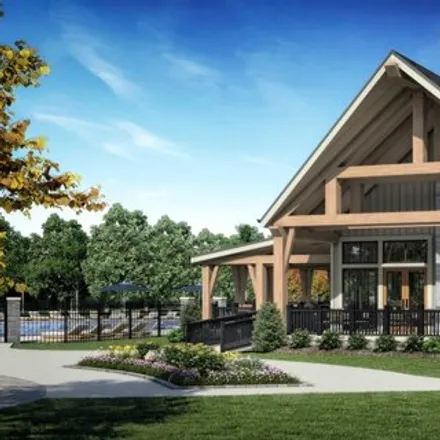
$532,854
$532,854
Available: Right Now
Fantastic open floor plan with Primary Suite, Living room with a gas fireplace and Study on the main floor Covered outdoor living area off the back of the home 3 bedrooms and a bath upstairs Greystone is Smyrna's newest Lifestyle Community featuring ...
$395,000
$395,000
Available: Right Now
Only one left - Spacious and modern end unit with 5 bedrooms and 3.5 baths! Lender incentives available. Townhouse includes two primary bedrooms with ensuite, stainless steel kitchen appliances, granite countertops in the kitchen, lots of stor...
$520,000
$520,000
Available: Right Now
Willow Branch's newest lifestyle community, Greystone, presents the Stewart B floor plan. This home features the primary bedroom on main level, butler's pantry, fireplace, covered back patio and so much more! Resort style pool and amenity center read...
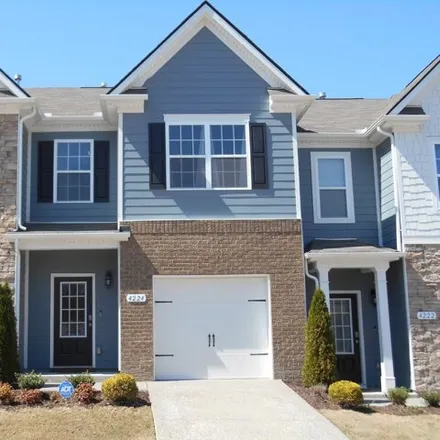
$334,900
$334,900
Available: Right Now
Great Location in the Heart of Smyrna! This Beautiful End Home is Convenient to I-24 and I-840 With Primary Bedroom Suites Both Upstairs and Downstairs. The Suite Downstairs has a Walk-in Closet and Bath With Separate Shower and Tub; The Upstairs Sui...
$495,000
$495,000
Available: Right Now
Welcome to your new home! No City Taxes! No HOA! This 3-bed, 3-bath home is all set for you to move in. Fresh paint and new flooring with a lifetime warranty throughout make this home look bright and clean. Newly installed windows and sliding glass k...
$394,000
$394,000
Available: Right Now
Spacious and thoughtfully designed Grifton Home fits the needs of many families. The Grifton includes a Covered Patio, and a well-equipped Kitchen plus 6' Kitchen Island that flows into an open Gathering and Dining on the main floor - perfect for ent...
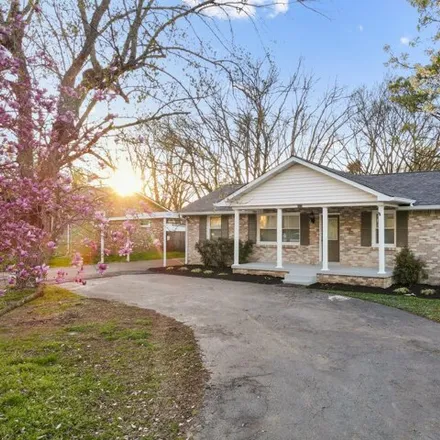
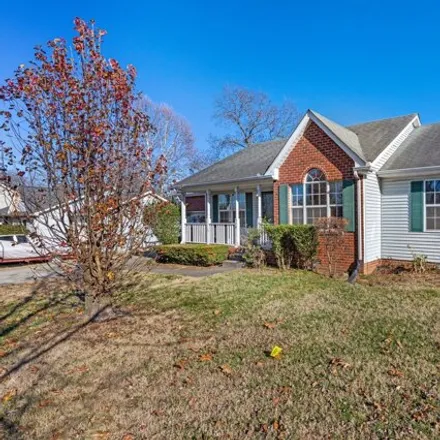
$399,000
$399,000
Available: Right Now
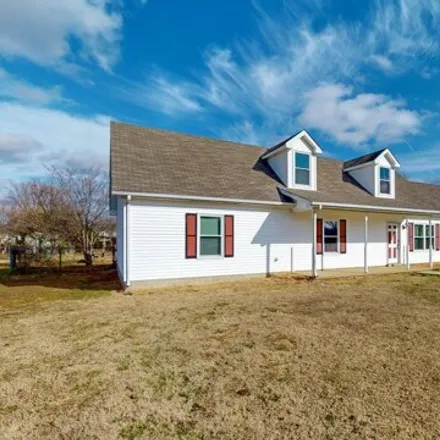
Welcome to your dream home! This stunning 3-bedroom, 2-bathroom ranch-style house has been meticulously renovated and is ready for you to move in and enjoy. Situated in a desirable neighborhood, this property offers both comfort and luxury.Open-conce...
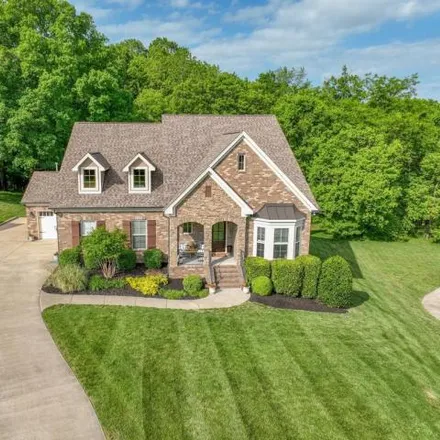
$679,900
$679,900
Available: Right Now
A must see! Stunning home backed by a beautiful woods setting!!! This 4 Bed 3 bath home offers 3 bedrooms and 2 full baths downstairs. An additional full-size bedroom and full bath upstairs w/oversize bonus room and a large walk out attic. The...
$332,900
$332,900
Available: Right Now
Welcome Home to popular Carothers Farm. Planned community with luxury living in your New first floor condo unit. Condo features an open-concept floor plan complete with crown molding, upgraded quartz countertops and stainless steel appliances....
$494,527
$494,527
Available: Right Now
This brick front home features a main level Primary Suite, Open Kitchen and Living room, formal dining room with a Butlers pantry, Walk-in Pantry and a covered back porch The second floor features a large bonus room, 2 bedrooms and a full bath Greyst...
$374,999
$374,999
Available: Right Now
Welcome to this charming one-level home nestled in Smyrna, offers the perfect blend of comfort and character. This residence boasts 3 bedrooms and 2 baths, featuring unique solid wood doors and trim as well as finished wood floors throughout that add...
$349,900
$349,900
Available: Right Now
Why wait to build ?!!! Stunning immaculate spacious Open Floorplan Hardwood Floors Granite Countertops Kitchen has a Gas stove for the Chef in you, Large Island, LOTS of cabinets, AND a pantry! Primary Bedroom has a Vaulted Ceili...
$399,900
$399,900
Available: Right Now
Willow Branch's newest lifestyle community, Greystone, features the Reed townhome floor plan. It is a well-designed interior unit townhome with the primary and additional bedrooms upstairs. The small courtyard and 1-car detached garage are also great...
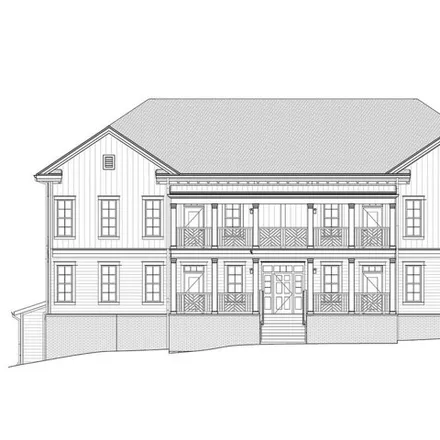
$567,893
$567,893
Available: Right Now
Willow Branch's newest lifestyle community Greystone, presents the Ramsay A floor plan. Our classic plus design package includes a covered porch, stained hardwood treads on the stairs, a brick fireplace with cedar mantle, quartz countertops, soft clo...
Smyrna
According to statistics, the population in Smyrna, TN amounts to 46,885, which shows growth 3% compared to the previous year. The median age of the city’s residents is 35. The average household income is $58,302, shifting growth 5% from the past year, and the average property value in Smyrna, TN growth 3% to $160,800 throughout the year.
| Population | 46,885 |
| Median Age | 34.9 |
| Poverty Rate | 12% |
| Household Income | $58,302 |
| Number Of Employees | 24,721 |
| Median Property Value | $160,800 |
What is the Average Price of Apartments for Sale in Smyrna, TN?
| Month | Median Price |
|---|---|
| Apr 2024 |
$297,743
|
| Mar 2024 |
$297,743
|
| Feb 2024 |
$297,743
|
| Jan 2024 |
$297,743
|
| Dec 2023 |
$303,519
|
| Nov 2023 |
$304,496
|
| Month | Median Price |
|---|---|
| Apr 2024 |
$467,227
|
| Mar 2024 |
$476,207
|
| Feb 2024 |
$476,207
|
| Jan 2024 |
$476,207
|
| Dec 2023 |
$429,035
|
| Nov 2023 |
$428,240
|
Household Income
The average household income in Smyrna, TN grew from $55,557 to $58,302 in the past year. This data is an estimate based upon 17,295 households in Smyrna, TN . The chart below presents how household income is distributed in Smyrna, TN in comparison to the revenue allocation amid households nationally.
Property Value
According to data from last year, the average property value in Smyrna, TN shifted from $155,500 to $160,800 throughout the year. The subsequent graph indicates the share of properties in the given price range in Smyrna, TN in comparison to the median property value in the same price segment across the country. According to the data, the greatest share of Smyrna, TN properties falls in the '$150,000 to $174,999' range, which is lower than the most significant median property across the country.
Rent vs. Own
Property Taxes
One of the most important aspects for property owners is the amount of property taxes. This graph shows distribution of property taxes in Smyrna, TN compared to median property taxes around the country. The prevalent amount of property taxes in Smyrna, TN equals $1150, which is less than the national average.