Tucson, AZ, USA apartments for sale

$2,45M
$2,45M
Available: Right Now
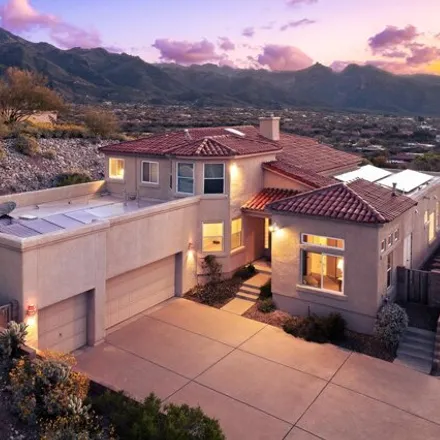
Experience breathtaking Catalina Mountain views at this exclusive estate in the prestigious Ventana Overlook. As you approach, Dramatic Custom Iron Doors framed in Cantera will welcome you into the Grand Foyer, leading into nearly7, 000square feet of...

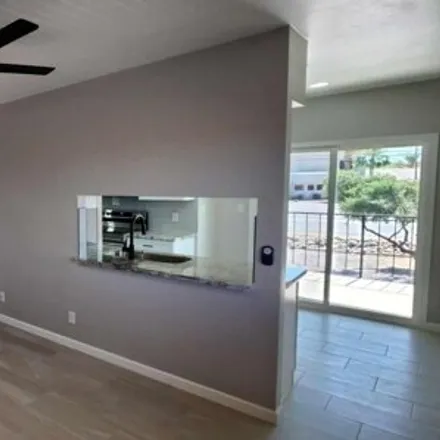
$328,900
$328,900
Available: Right Now
Spacious renovated second floor corner unit condo in the luxurious resort style community of The Ventana Vista Condos. This private Catalina Foothills property features travertine tile flooring throughout, newer dual pane windows, cozy wood burning t...
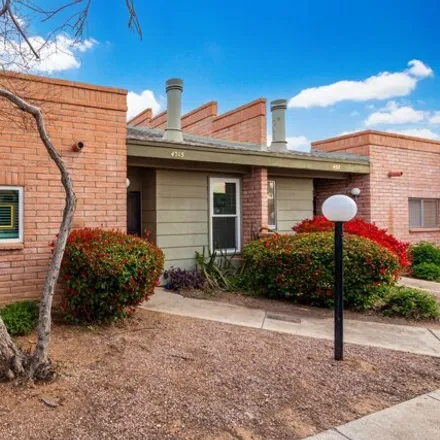
$259,900
$259,900
Available: Right Now
This charming and meticulously maintained townhome is located in the desirable central Tucson. Walk in to the open and naturally bright space, soaring ceilings with exposed beams. Tasteful custom paint scheme, dual pane windows throughout, modern con...
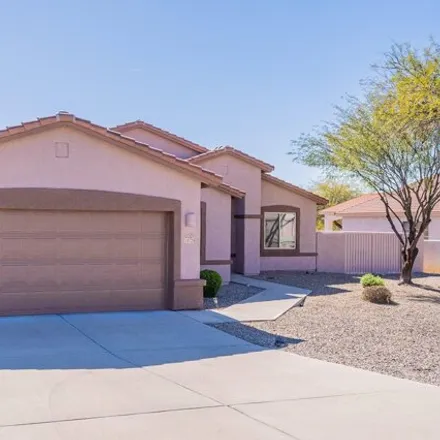
$470,000
$470,000
Available: Right Now
Upon entering, you'll be greeted by an inviting atmosphere with abundant natural light streaming through large windows. The spacious living area is perfect for relaxation or entertaining guests. Adjacent to the living space is a modern kitchen equipp...

$695,000
$695,000
Available: Right Now
Opportunity is knocking in the desirable Jefferson Park community. Conveniently located on the corner of Edison and Mountain Ave is a Gorgeous updated 3 bedroom/3 bathroom main house + a 1 bedroom/1 bathroom Guest house. Property is completely enclos...
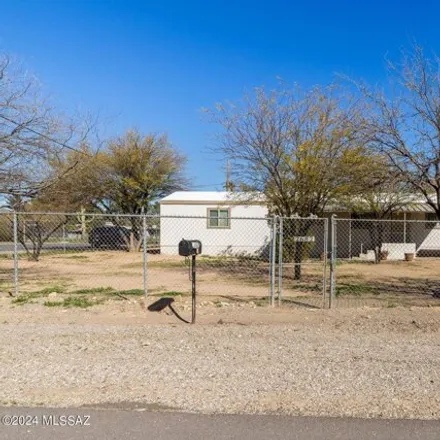
$289,000
$289,000
Available: Right Now
Great opportunity for rental income or home with enough room for the family! 4 bedroom 2 bath with extra room for pantry, office, workout room. Corner lot with huge yard and double gate for carport and backyard access. All tile keeps it cool in the s...

$398,000
$398,000
Available: Right Now
Welcome to your impeccably maintained La Estancia Richmond Peridot home! Built in 2021, this 3 bedroom 2bath, (plus a den!) home boasts a roomy kitchen perfect for gatherings, with upgrades to include quartz countertops, 42'' dark upper cabinets, sub...

$310,000
$310,000
Available: Right Now
Luxury condo community in prime location. Nestled in the heart of the foothills, the Villas at Hacienda Del Sol offers resort-style living with prime access to the River Walk, St. Phillips Plaza, and the Farmers Market. This immaculate, 2-bed/2-bath ...

$443,000
$443,000
Available: Right Now
This impeccable home is ready for you to move right in. Originally a model home for the esteemed Pepper-Viner Camino Modern development, on a premium large lot, it features 4 bedrooms and 3 baths. The exterior has been recently painted, and it is sur...

$465,000
$465,000
Available: Right Now
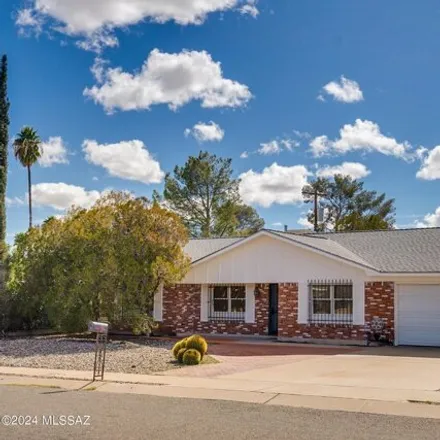
MUST SEE! Adorable home in Tucson is the one! Beautifully updated interior boasting tile flooring, fresh soft paint and plush carpets. The HUGE living room w/ easy access to all area and back patio. Bright kitchen offers recessed lighting, plenty of ...
$159,900
$159,900
Available: Right Now
Centrally located this one-bedroom, one-bathroom condominium offers an efficiently designed layout with a spacious open living room. Completely renovated and modernized, the property features a brand-new kitchen with granite countertops complemented ...
$865,000
$865,000
Available: Right Now
Center of the Foothills gated 5 bedroom, 4 bathroom, 3, 463Sq Ft home strategically placed on an elevated lot overlooking the Catalina Mountains and vast desert valley. Private neighborhood with only 30 homes, the Ventanas del Oeste neighborhood is c...
$420,000
$420,000
Available: Right Now
Welcome to this delightfully inviting home positioned in a quiet and desirable cul-de-sac location, centered within the beautiful, family-friendly El Dorado Hills area of the El Gheko neighborhood. This spacious home has an easy-living flow including...

$114,900
$114,900
Available: Right Now
Range priced $114, 900.-125, 000.00. Lovely 3 bdrm 2 ba home with a HUGE screened in Az Room, perfect for our Tucson weather or make it a play room, craft room or exercise room. This home has a newer AC unit, newly coated roof, NO carpet, open...

$359,900
$359,900
Available: Right Now
Location, Location, Location. This modern gated new townhome complex is ready to move into. Only minutes to the UofA, hospitals, restaurants, shops, golf and biking. Three bedrooms all with their own bathroom. The master suite has two large walk in c...

$925,000
$925,000
Available: Right Now
Welcome to a true masterpiece of Southwest architecture crafted by renowned builder Andy Arena. This adobe home stands as a testament to timeless elegance and craftsmanship, boasting exquisite beamed wood inlaid ceilings that elevate the home with wa...

$399,000
$399,000
Available: Right Now
Seller will accept/counter offers btwn$399K - $410K.Great single story split bedroom floorplan in Rocking K Community. Home features, 4 bedrooms, 2 bathrooms, 9 foot ceilings throughout; large open kitchen tons of counter top space, stainless steel a...

$285,000
$285,000
Available: Right Now
Take a look to this New construction 3 beds 2 baths house withNO HOA.Tile floor throughout the house plus granite countertops on kitchen. New Stainless Steel Electric Range and OTR Microwave to be installed prior to closing. Great house for fi...
$475,000
$475,000
Available: Right Now
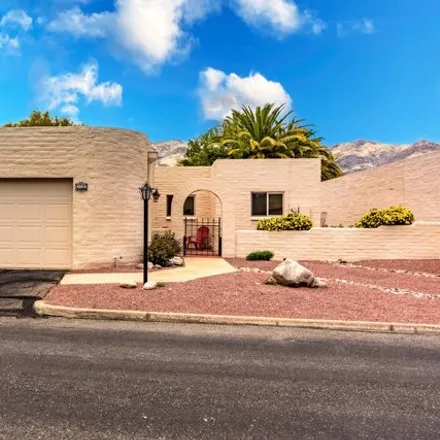
Welcome to luxury living in the Catalina Foothills! This delightful patio home features a spacious 2-bed, 2-bath floorplan with numerous recent upgrades. Within the past 2 years, the home has been meticulously enhanced with new windows, doors, waterp...

$389,500
$389,500
Available: Right Now
Large backyard, NO HOABright and clean single-story brick home located in desirable East side neighborhood. Large.19 acre lot with mountain views. Quiet cul-de-sac. Freshly updated interior, waterproof vinyl plank flooring throughout, new high effici...
$285,000
$285,000
Available: Right Now
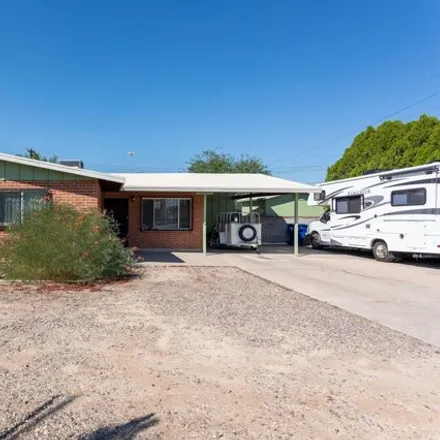
Check out this Eastside Charmer. 3 bedroom, 2 bath Ranch Inviting and bright family home. Kitchen and bathrooms have been remodeled, lots of storage options throughout, with big closets, and large storage/workshop area outside. Oversized carport and ...

$600,000
$600,000
Available: Right Now
One of the largest lots in the community, cul-de-sac, mountain view, 3 car tandem garage, rare to find. Won't last long!This masterpiece is a testament to contemporary and thoughtful design! Soaring dramatic Ironwood Model home -2 story great ...
Tucson
According to statistics, the population in Tucson, AZ amounts to 545,987, which shows growth 2% compared to the previous year. The median age of the city’s residents is 34. The average household income is $43,676, shifting growth 5% from the past year, and the average property value in Tucson, AZ growth 12% to $167,800 throughout the year.
| Population | 545,987 |
| Median Age | 33.5 |
| Poverty Rate | 24% |
| Household Income | $43,676 |
| Number Of Employees | 249,028 |
| Median Property Value | $167,800 |
What is the Average Price of Apartments for Sale in Tucson, AZ?
The average sale price for apartment in Tucson, AZ: $142,712
(+22.5%)
| Month | Median Price |
|---|---|
| Jun 2024 |
$143,906
|
| May 2024 |
$160,673
|
| Apr 2024 |
$162,889
|
| Mar 2024 |
$162,889
|
| Feb 2024 |
$162,889
|
| Jan 2024 |
$162,889
|
| Month | Median Price |
|---|---|
| Jun 2024 |
$142,712
|
| May 2024 |
$116,453
|
| Apr 2024 |
$201,515
|
| Mar 2024 |
$201,515
|
| Feb 2024 |
$201,515
|
| Jan 2024 |
$201,515
|
Household Income
The average household income in Tucson, AZ grew from $41,613 to $43,676 in the past year. This data is an estimate based upon 209,383 households in Tucson, AZ . The chart below presents how household income is distributed in Tucson, AZ in comparison to the revenue allocation amid households nationally.
Property Value
According to data from last year, the average property value in Tucson, AZ shifted from $150,400 to $167,800 throughout the year. The subsequent graph indicates the share of properties in the given price range in Tucson, AZ in comparison to the median property value in the same price segment across the country. According to the data, the greatest share of Tucson, AZ properties falls in the '$150,000 to $174,999' range, which is higher than the most significant median property across the country.
Rent vs. Own
Property Taxes
One of the most important aspects for property owners is the amount of property taxes. This graph shows distribution of property taxes in Tucson, AZ compared to median property taxes around the country. The prevalent amount of property taxes in Tucson, AZ equals $1150, which is less than the national average.