Tullahoma, TN, USA apartments for sale

$249,900
$249,900
Available: Right Now
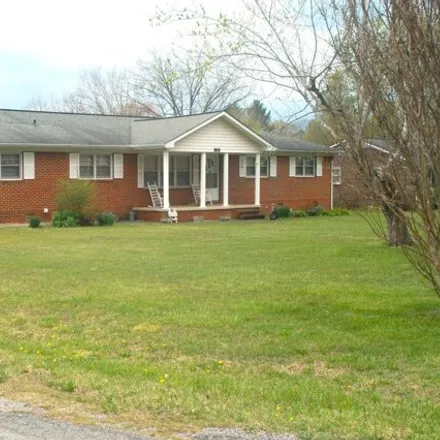
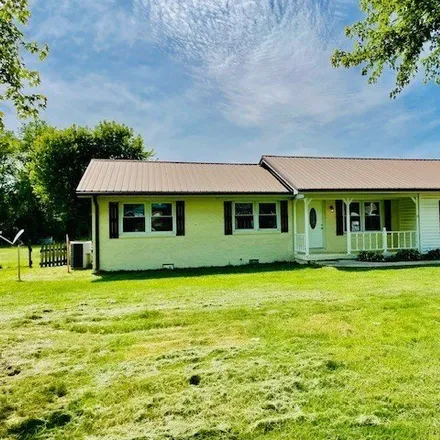
One level brick ranch in the heart of town that was totally renovated in 2023! All new kitchen cabinets that reach the ceiling with granite countertops and SS appliances, new vanity and shower/tub, new windows throughout, new carpet in the bedrooms a...
$299,900
$299,900
Available: Right Now
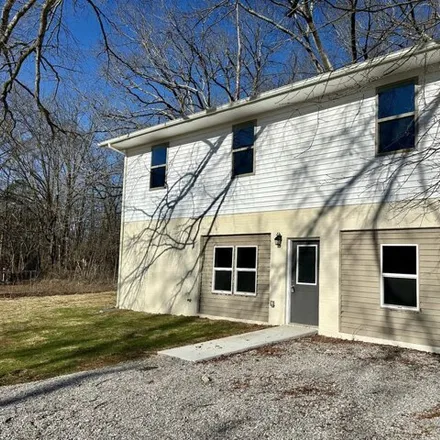
The Home Features An Open And Spacious Layout With 5 Bedrooms And 2.5 Baths. Everything is NEW: New Flooring, New Paint, New Appliances, New Cabinets And Countertops, New Remodeled Bathrooms, and New Siding. There Is A Big Living Room Area, And A Nic...

$198,000
$198,000
Available: Right Now
Nestled in the charming town of Tullahoma, Tennessee, Willow Oak Place offers an inviting opportunity for first-time home buyers. This townhome boasts1, 188square feet spread across two stories, providing ample space for comfortable living. The conve...

$89,999
$89,999
Available: Right Now
This owner-occupied property is ready for your vision. With a rental repair estimate of$28, 000and a flip-grade rehab estimate of$43, 000,it offers excellent potential returns. Boasting an ARV of$160, 000and a market rent potential of $900/month, it'...
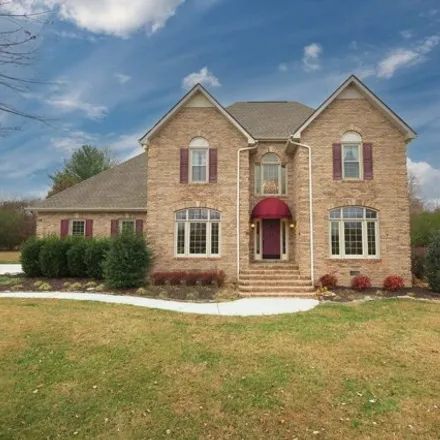
$299,900
$299,900
Available: Right Now
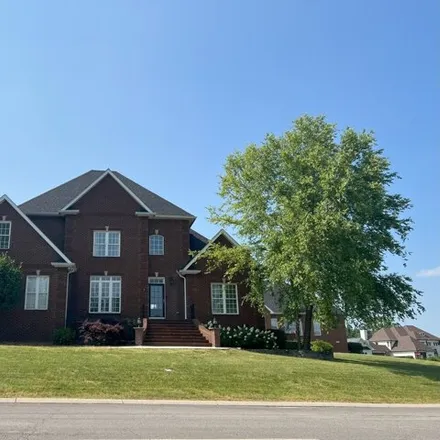
Welcome to Crest Drive Tullahoma, TN. This gem is in a convent location to school, shopping, restaurants, and roughly 20 minutes to the interstate. This home sits on a corner lot in a quiet and established neighborhood. Come look at this home and the...

$270,000
$270,000
Available: Right Now
Welcome Home! Discover this immaculate 3-bedroom, 2-bath gem nestled in a quiet and family-friendly neighborhood, just a stone's throw from Bel Aire Elementary. This charming residence offers a spacious and well-designed interior featuring three gene...

$390,000
$390,000
Available: Right Now
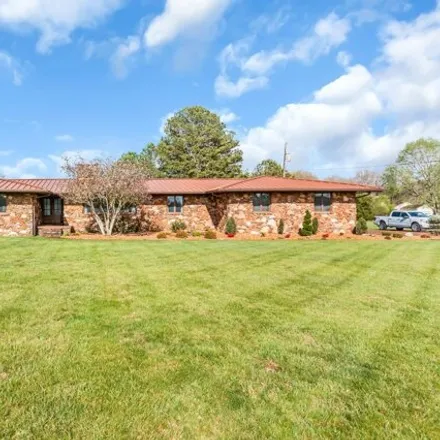
Check out this all brick, single story home. Great floorplan with zoned bedrooms. LVP flooring in common areas and tile in bathrooms/laundry room. Vaulted ceiling in living room is open to the kitchen and dining area. Large island in the kitchen with...
$569,900
$569,900
Available: Right Now
Come see this Beautiful4BR 3.5 BAhome located in highly sought after Setters Point with view of Tullahoma Lake, access to cart path on Lakewood Country Club, Scott Gregory build, MB includes recessed lighting, crown molding, tiled shower/jacuz...

$799,000
$799,000
Available: Right Now
Welcome to this custom-built Craftsman-style home, located on a corner lot just outside Tullahoma's city limits and within 1 mile of a public boat ramp at Tim's Ford Lake. As you step inside, you'll be greeted by soaring ceilings and an open floor pl...
$254,900
$254,900
Available: Right Now
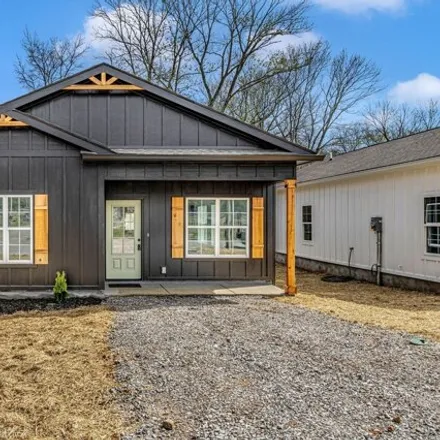
Builder offering $3000 flex cash to be used towards closing costs, rate buy-down, etc !!! Brand-New One-Level Home with Chic Farmhouse Vibes in Tullahoma! Situated only 0.4-miles from Jefferson Street Park and 11.7-miles from Arnold Airforce B...

$599,000
$599,000
Available: Right Now
Welcome to 105 Blantonwood Dr.! This property features a spacious lot w/a stunning5 BR, 3.5 BAlayout. Step into a grand 2-story entry foyer, leading to formal living and dining rooms perfect for entertaining guests. Cozy up in the den by the gas fire...

$569,900
$569,900
Available: Right Now
Welcome to 100 Kings Place, a stunning all-brick home nestled in the highly coveted neighborhood of Kings Place. This immaculate residence boasts 4 bedrooms and 3.5 bathrooms, including a luxurious primary suite on the main level. Upon entry, you'll ...
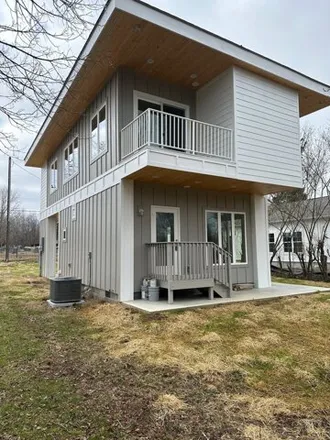
$324,900
$324,900
Available: Right Now
The most unique house in Tullahoma! This a newly built, 2-story house in the heart of Tullahoma. House features a slab/crawl space design with brand new everything - just finished being built! The balconies are the highlight of this piece of art. Car...
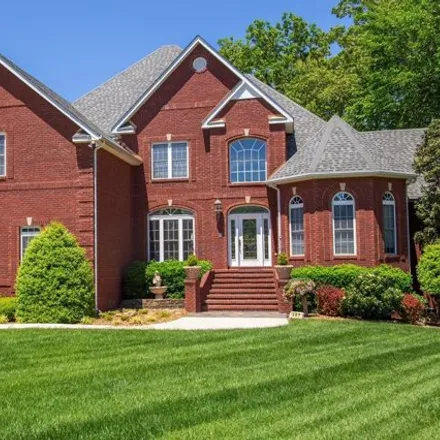
$614,900
$614,900
Available: Right Now
A rare find:Looking for its next owners personal touches and priced with those changes in mind beautiful all brick executive home located near and easy access to fairways of Lakewood GC with many wonderful features. 4 bedroom/3.5 bath home with appro...
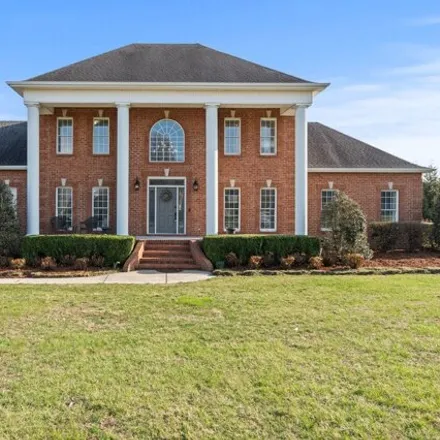
$985,000
$985,000
Available: Right Now
Luxurious 6 Bedroom, 4.5 bath home with amazing floorplan and an array of amenities including separate in-law quarters. Large formal Dining Room open to the Great Room. The front of the home has Office w/ beautiful built ins. The Kitchen is truly the...
$850,000
$850,000
Available: Right Now
Stunning two story4, 254square foot 4 bedroom 3.5 bath home with large bonus room, downstairs primary suite with renovated bathroom featuring a copper vessel tub, custom tile shower, custom organizational shelving in the primary closet, spacious room...
$629,900
$629,900
Available: Right Now
This beautiful one of a kind ranch home sits on 3 acres and is a DREAM! Completely remodeled with many unique and original features. Depersonalized, freshly painted and ready for you! Through the doors you will find 4 large Bedrooms, 3 Full Baths, Li...
$349,900
$349,900
Available: Right Now
Wonderful transformation of this updated ranch style3BR/2.5 BAhome that includes a Florida Room, Living Room and Recreation Room (could be used as a BR if desired), home has had interior and exterior painting, new LVP flooring throughout and beautifu...

$499,900
$499,900
Available: Right Now
Beautiful home with wrap around porch nestled on a large wooded corner lot. Offers 4 bedrooms, (spacious master suite) 2.5 baths, approx. 3110 SFof living area. A remodeled eat in kitchen with quartz countertops, office, bonus room, dining room, fami...

$424,900
$424,900
Available: Right Now
Beautiful and well-maintained home in the sought after Tara Estates subdivision. This home is2818 SFwith 4 Bedrooms, 2 full Baths and a half-bath, Kitchen, Living Room, Den with fireplace, Dining Room, Gathering Room, fantastic 24x48 detached garage,...

$326,555
$326,555
Available: Right Now
Charming brick home in the heart of Tullahoma. Located within minutes of shopping centers, restaurants, and parks. This all brick home features an open floor plan with 2 bedrooms, 1 bath in the on main living level, and a full, finished basement read...

$499,900
$499,900
Available: Right Now
Great opportunity to own a house and 5 acres in town! This charming, brick, 4 bedroom/3 bath home has been well maintained and loved by the original owner. Much of the home has the original hardwood flooring and it is in excellent condition. The kitc...
Tullahoma
According to statistics, the population in Tullahoma, TN amounts to 19,037, which shows decline -1% compared to the previous year. The median age of the city’s residents is 40. The average household income is $39,858, shifting growth 3% from the past year, and the average property value in Tullahoma, TN growth 1% to $116,300 throughout the year.
| Population | 19,037 |
| Median Age | 40.4 |
| Poverty Rate | 18% |
| Household Income | $39,858 |
| Number Of Employees | 7,824 |
| Median Property Value | $116,300 |
What is the Average Price of Apartments for Sale in Tullahoma, TN?
| Month | Median Price |
|---|---|
| Jun 2024 |
$271,981
|
| May 2024 |
$284,783
|
| Apr 2024 |
$289,556
|
| Mar 2024 |
$289,556
|
| Feb 2024 |
$289,556
|
| Jan 2024 |
$289,556
|
| Month | Median Price |
|---|---|
| Jun 2024 |
$325,938
|
| May 2024 |
$334,385
|
| Apr 2024 |
$321,640
|
| Mar 2024 |
$321,640
|
| Feb 2024 |
$321,640
|
| Jan 2024 |
$321,640
|
Household Income
The average household income in Tullahoma, TN grew from $38,665 to $39,858 in the past year. This data is an estimate based upon 8,194 households in Tullahoma, TN . The chart below presents how household income is distributed in Tullahoma, TN in comparison to the revenue allocation amid households nationally.
Property Value
According to data from last year, the average property value in Tullahoma, TN shifted from $114,900 to $116,300 throughout the year. The subsequent graph indicates the share of properties in the given price range in Tullahoma, TN in comparison to the median property value in the same price segment across the country. According to the data, the greatest share of Tullahoma, TN properties falls in the '$100,000 to $124,999' range, which is lower than the most significant median property across the country.
Rent vs. Own
Property Taxes
One of the most important aspects for property owners is the amount of property taxes. This graph shows distribution of property taxes in Tullahoma, TN compared to median property taxes around the country. The prevalent amount of property taxes in Tullahoma, TN equals $1150, which is less than the national average.