Urbandale, IA, USA apartments for sale
$555,000
$555,000
Available: Right Now
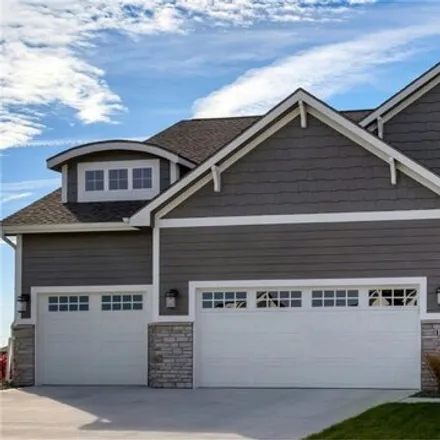
Builder promo of $5000: to be used towards rate buy down, upgrades, pre-paid/closing costs. Promo ends4/01/24You're going to love this modified Rochester plan by Orton Homes with over 2600 sq ft of finish! We have added additional square foota...
$605,000
$605,000
Available: Right Now
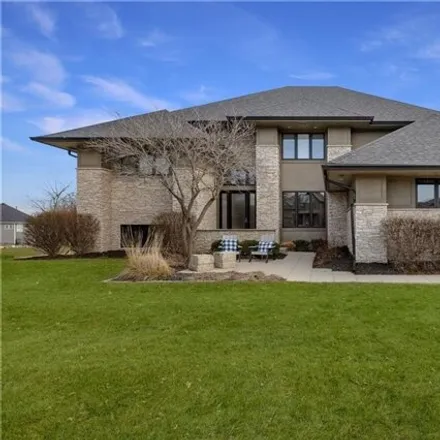
Nestled on nearly an acre of picturesque land in Johnston's Green Meadows West neighborhood, this inviting walkout ranch seamlessly blends modern elegance with the tranquility of nature. You will be greeted by an expansive, open floor plan that effor...
$321,000
$321,000
Available: Right Now
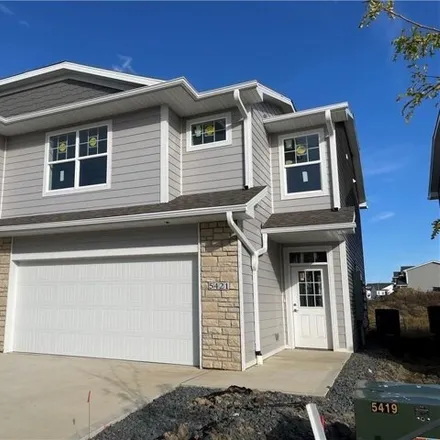
Waterford Creek South Townhomes with a modern feel and large windows for an abundance of natural light. Open kitchen with white cabinetry with snack bar, quartz countertops, pantry, and Stainless-steel appliances. The kitchen opens to the dining area...
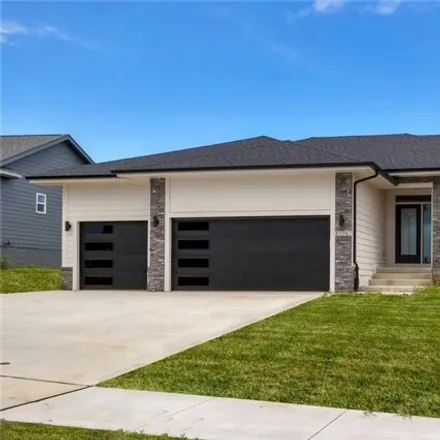
$498,750
$498,750
Available: Right Now
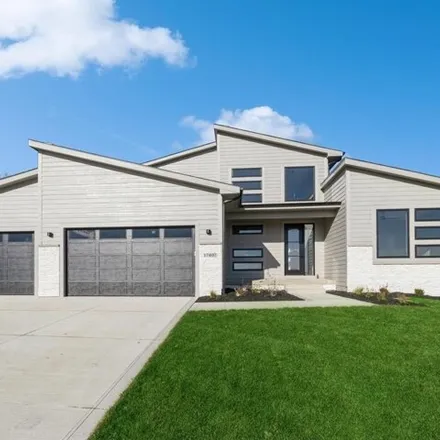
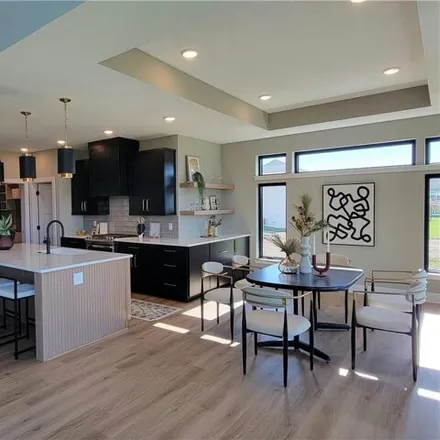
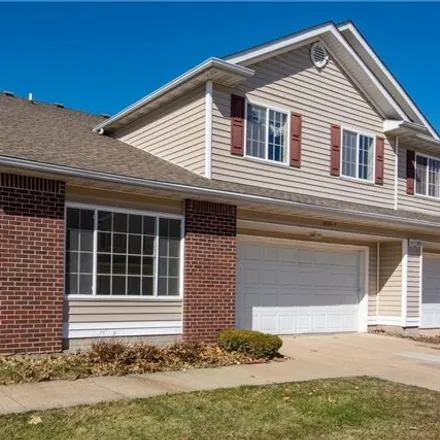
Clean line, modern walk-out ranch home located in the sought-after Urbandale neighborhood, just one block off of Hickman Road by CVS Pharmacy and 10 minutes to Waukee. Step inside this home and fall in love with its open floor plan seamlessly connect...
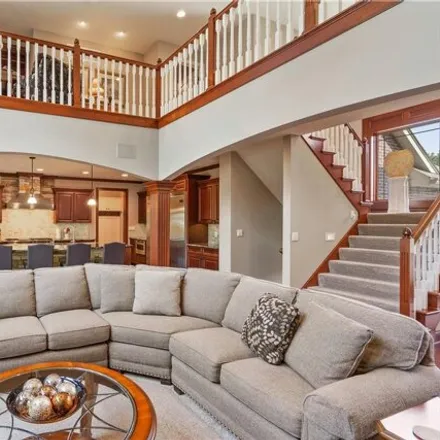
$1,04M
$1,04M
Available: Right Now
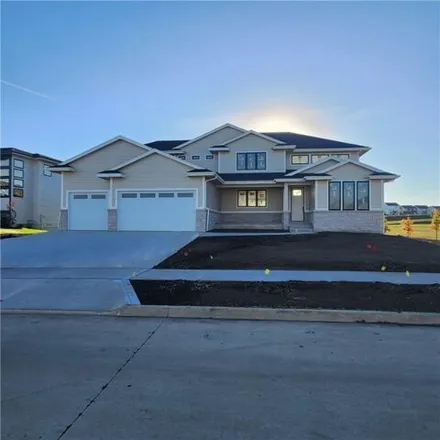
Builder offering$10, 000in allowances! New walkout 1.5 story 5 bedroom, 4 bath home in Shadow Creek on beautiful lot backing to trees. Main level has large front office, hard surface throughout, 2 story stone fireplace and custom iron open staircase....
$920,000
$920,000
Available: Right Now
Seller offering$20, 000in buyer upgrades or changes on this walkout 1.5 story with grand two story entry and great room providing second floor catwalk. Oversized great room with 3 sided asymmetrical fireplace provides extra space for eye level TV pla...
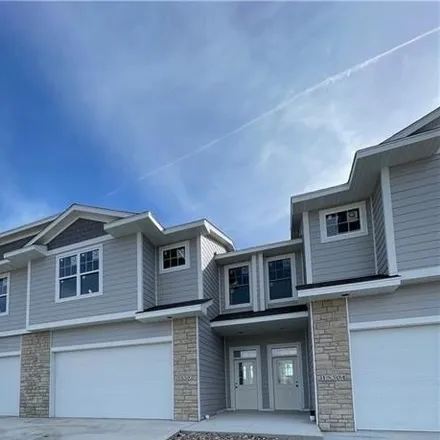
$289,000
$289,000
Available: Right Now
Waterford Creek South Townhomes with a modern open feel and soaring windows for an abundance of natural light. Open kitchen with white cabinetry, snack bar, quartz counters, pantry, and stainless steel appliances. The kitchen opens to the dining room...
$1,2M
$1,2M
Available: Right Now
Almost 5000 square feet of finished living area in this modern 1.5 story located in one of the most desired neighborhoods on the west side! Offering 6 bedrooms, 6 bathrooms, a massive 4 stall garage (1223 sq ft), an end of cul-de-sac lot overlooking ...
$445,000
$445,000
Available: Right Now
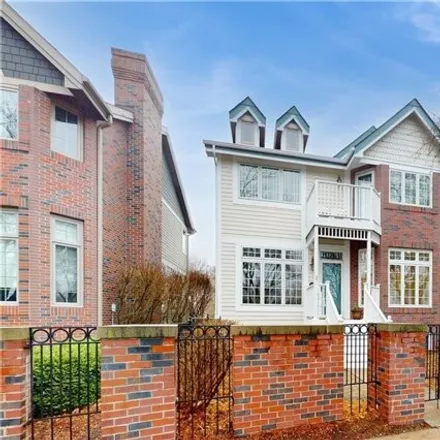
This enchanting residence at Crescent Chase Terrace is more than a mere dwelling; its a way of life. Step through an iron gate into a brick-walled garden, reminiscent of the pages of a Jane Austen novel. Fast forward to 2024 and a stunning interior r...
$255,000
$255,000
Available: Right Now
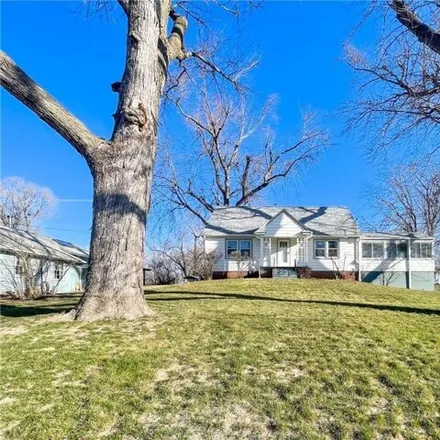
Discover the allure of this charming home nestled in a picturesque Urbandale neighborhood. Positioned on a corner lot, the residence boasts a spacious yard and an inviting composite porch that sets the tone for a warm welcome. Inside, the kitchen, di...
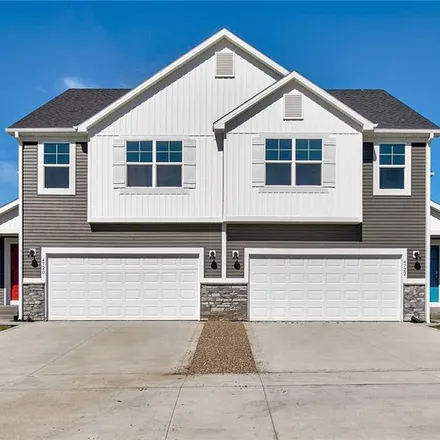
$582,070
$582,070
Available: Right Now
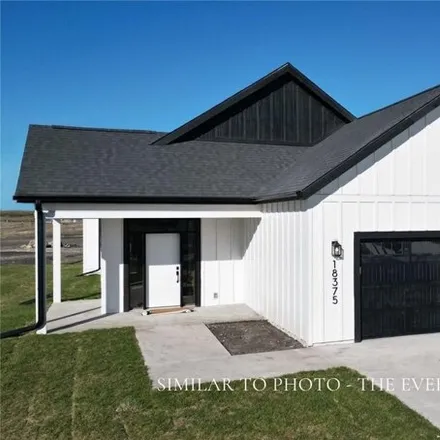
Introducing the Evergreen villa with over 2000 sf of living space! Imagine the luxury of owning a standalone villa in the vibrant active adult community of Amare Vita at Shadow Creek! Embrace this exceptional opportunity to transform your dream into ...
$292,000
$292,000
Available: Right Now
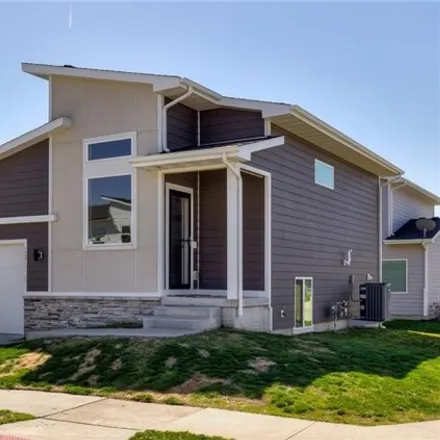
Check out this modern and stylish 3 bedroom /2.5 bath, split level single family home. Large windows give wonderful light to the open main level floor plan. Beautiful quartz countertops, stainless steel appliances and a nice pantry help accentuate a ...
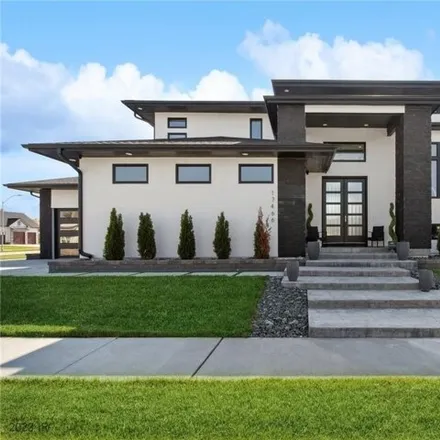
$1,2M
$1,2M
Available: Right Now
Executive home with all the upgrades! Livingroom has a stone fireplace surrounded by 2 stories of windows. Built -in entertainment center with ideal TV and decor placement adds warmth and functionality. Oversized chefs' kitchen is an ideal cooking sp...
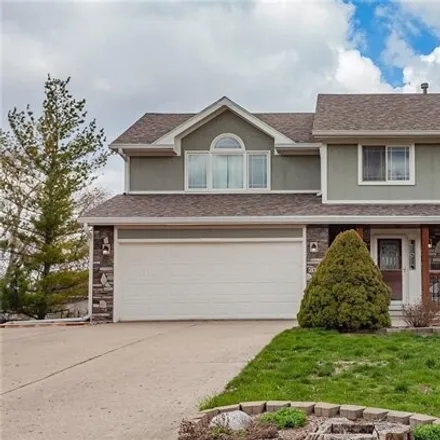
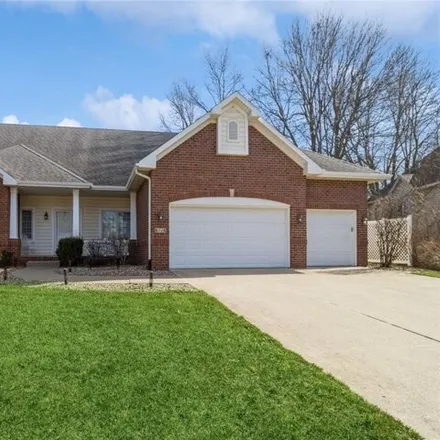
$399,900
$399,900
Available: Right Now
Immaculate and conveniently located two story Urbandale home in the Johnston School District! Great sized cul-de-sac lot with mature trees. Easy interstate access. Ample kitchen with granite countertops, tiled backsplash, a formal dining room/office/...
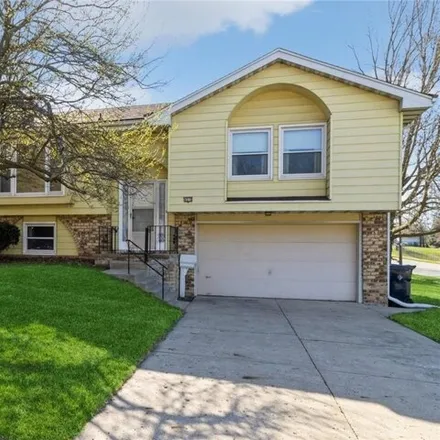
$294,900
$294,900
Available: Right Now
Updated and affordable Urbandale home. Improvements include a new roof ('22), HVAC ('17), SS appliances, lVP flooring, maintenance-free steel siding, and vinyl replacement windows. Master offers separate his/her closets. Family room with fireplace do...
$359,950
$359,950
Available: Right Now
You will love this 2-story daylight lot plan by clover & hive! It is the perfect plan! This honeydew home includes lots of open space for activities. Enjoy a separate living room and dining area on the main floor along with all 4 bedrooms upstairs. O...
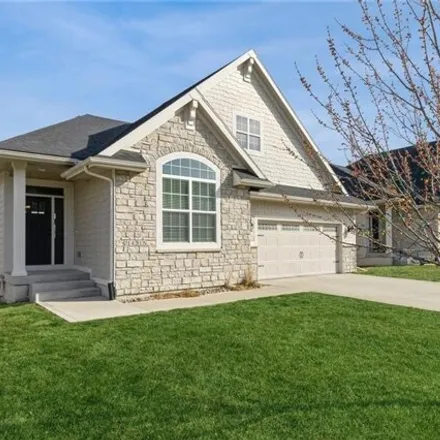
$825,000
$825,000
Available: Right Now
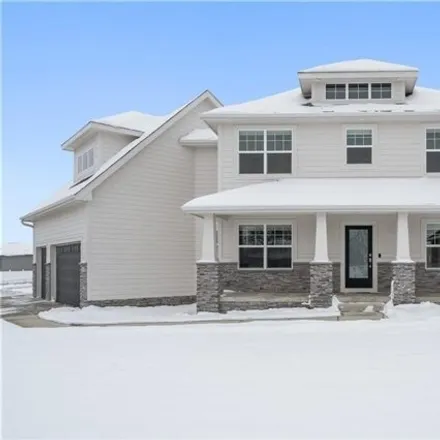
Introducing the Burberry II Plan by Kimberley Development, a renowned builder with over 45 years of experience in crafting stately and sophisticated homes. This floor plan is similar to, although finishes and style may vary. This home is located in B...
$905,000
$905,000
Available: Right Now
New 1.5 story with your finish choices. Owner's suite has 2 private closets, soaking tub, and beautiful shower and located next to the laundry room. Open kitchen to grandiose great room and windows. Island has plenty of seating for casual mornings or...
$850,000
$850,000
Available: Right Now
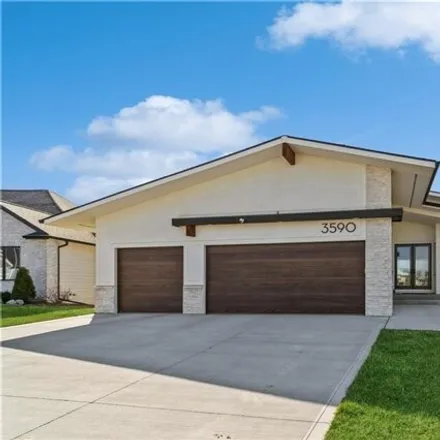
Come check out this spacious modern ranch home backing to a treeline and a park in Clive. This house comes loaded with upgrades including the tile work throughout the main level, custom walnut cabinets, the custom large pantry, and the custom bar tab...
$589,900
$589,900
Available: Right Now
This 2-story home in the Waukee Northwest school district is sure to impress! And this location cant be beat! Sitting on a large.4 acre lot on a cul-de-sac, the Grant Ragan elementary school, Fox Creek Park, and Waukee YMCA are all within walking dis...
$234,900
$234,900
Available: Right Now
Imagine the sunlight streaming into your living room as you cozy up by the fireplace and sip your morning coffee. This 3-bedroom. 3-bathroom end-unit townhome in Johnston's Bent Tree Villas makes everything feel possible. The kitchen has a large pant...
$1,78M
$1,78M
Available: Right Now
Welcome to this stunning masterpiece of design, offering the finest in modern amenities and magnificent features. Upon entering you will be captivated by its elegance and awe-inspiring interior that showcases a glamorous entry and btfl finishes. The ...
Urbandale
According to statistics, the population in Urbandale, IA amounts to 42,222, which shows growth 2% compared to the previous year. The median age of the city’s residents is 39. The average household income is $85,432, shifting growth 4% from the past year, and the average property value in Urbandale, IA growth 6% to $216,100 throughout the year.
| Population | 42,222 |
| Median Age | 38.5 |
| Poverty Rate | 6% |
| Household Income | $85,432 |
| Number Of Employees | 23,357 |
| Median Property Value | $216,100 |
What is the Average Price of Apartments for Sale in Urbandale, IA?
| Month | Median Price |
|---|---|
| Apr 2024 |
$460,259
|
| Mar 2024 |
$460,259
|
| Feb 2024 |
$460,259
|
| Jan 2024 |
$460,259
|
| Dec 2023 |
$467,397
|
| Nov 2023 |
$590,708
|
| Month | Median Price |
|---|---|
| Apr 2024 |
$373,257
|
| Mar 2024 |
$373,257
|
| Feb 2024 |
$373,257
|
| Jan 2024 |
$373,257
|
| Dec 2023 |
$484,298
|
| Nov 2023 |
$449,455
|
Household Income
The average household income in Urbandale, IA grew from $81,862 to $85,432 in the past year. This data is an estimate based upon 16,424 households in Urbandale, IA . The chart below presents how household income is distributed in Urbandale, IA in comparison to the revenue allocation amid households nationally.
Property Value
According to data from last year, the average property value in Urbandale, IA shifted from $204,700 to $216,100 throughout the year. The subsequent graph indicates the share of properties in the given price range in Urbandale, IA in comparison to the median property value in the same price segment across the country. According to the data, the greatest share of Urbandale, IA properties falls in the '$200,000 to $249,999' range, which is lower than the most significant median property across the country.
Rent vs. Own
Property Taxes
One of the most important aspects for property owners is the amount of property taxes. This graph shows distribution of property taxes in Urbandale, IA compared to median property taxes around the country. The prevalent amount of property taxes in Urbandale, IA equals $3000, which is less than the national average.