Apple Valley, CA, USA apartments for rent
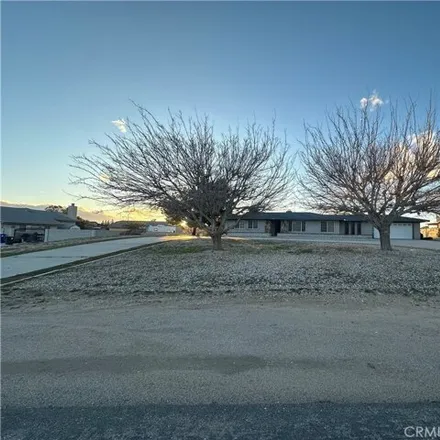
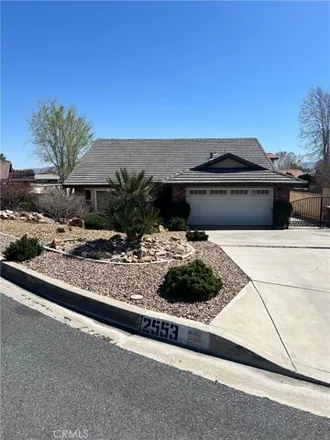
$2,600
$2,600
Available: Right Now
Enjoy this roomy 3 bedroom, 2 bath home located on almost 1 acre of land. Home features living room/dining room combo in front with plantation shutters to let in all the sunlight. The kitchen opens up to a family room with a large fireplace perfect f...
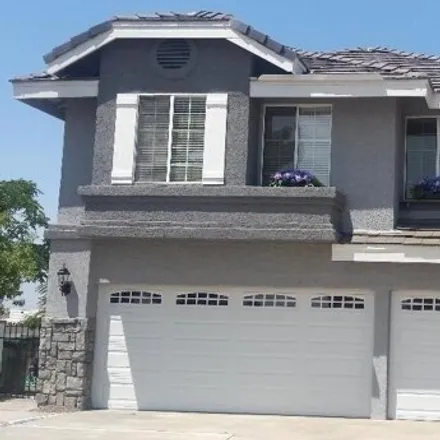
$3,075
$3,075
Available: Right Now
For lease ! Beautiful Cottage style Custom Home in Av ridge estates, gated community, 4 Spacious Bdr, 2.5 baths, RecentCARPETthroughout, Crown Molding, French Doors, Huge Kitchen opens to Family Room, For. Living Room and Formal ...

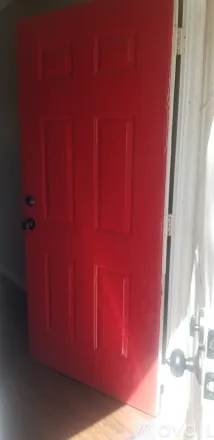
$1,350
$1,350
Available: Right Now
Introducing a charming 2-bedroom, 1-bathroom apartment located in Apple Valley, CA. This cozy unit features a small backyard, perfect for enjoying the outdoors right at home. With a single car garage, you'll have convenient parking and extra storage ...

$1,700
$1,700
Available: 22/07/2024
This charming apartment features 2 Master Bedrooms with Walk in Closets and 2 Modern Bathrooms. The living space is open and inviting with updated flooring and freshly painted walls throughout the whole apartment. EXTRAS -Private Backyard, Two Ca...
$2,750
$2,750
Available: Right Now
Lovely 5 bedroom, 2 bath family home in the Vineyards area north of Sitting Bull and west of Tamiani, with formal living and dining rooms, family room with fireplace off the open kitchen with dinette area, loads of cabinets and granite countertops. A...

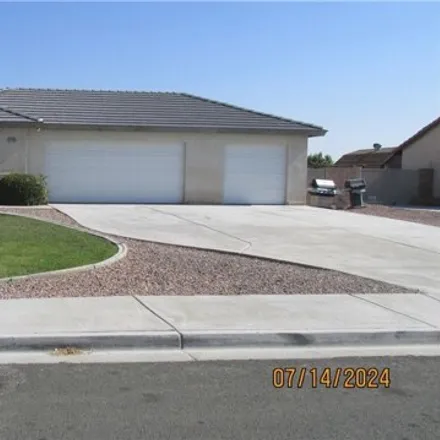
$2,200
$2,200
Available: Right Now
Located in original Jess Ranch. Property is turnkey. All upgraded flooring, Appliances. Large open living room, Great Master Br with separate door out to big Patio area, Single car garage but tenant can get additional parking. Walking distance to the...
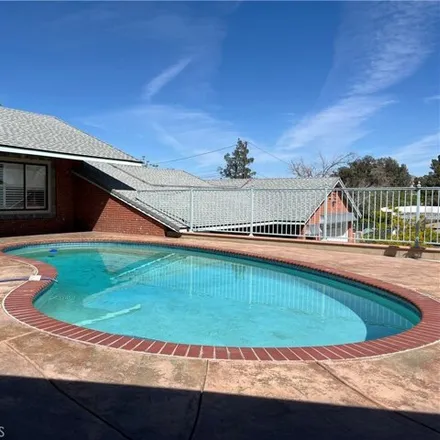
$4,300
$4,300
Available: Right Now
Welcome to this spacious 5 bedroom + bonus room, 4 bathroom , and a pool.... home in Apple Valley! This beautiful house features tile flooring throughout, making cleaning a breeze. Enjoy the convenience of indoor laundry, saving you time and energy. ...

$1,650
$1,650
Available: 01/08/2024
Quiet small complex with long term tenants. We just renovated this unit. New tile flooring throughout the apartment and a large garage with w/d hookups. Backyard with a beautiful view of the mountains. If you are interested in a tour of the apartment...

$2,100
$2,100
Available: Right Now
Spacious 3 bedroom 2 bath home located in quiet neighborhood. Property features large master bedroom, large 1 acre lot, central air and heating, beautiful spiral stair case leading up to a loft that can be used as a 4th bedroom or office, indoor laun...

$2,500
$2,500
Available: Right Now
Welcome to 13821 Okesa Rd, Apple Valley, CA, where comfort and style converge in this inviting 3-bedroom, 2-bathroom residence spanning1, 841square feet. Nestled in a serene neighborhood, this home offers a blend of modern amenities and classic charm...

$6,450
$6,450
Available: Right Now
This 2-bedroom apartment is perfect for your escape to Apple Valley. Nestled in a peaceful neighborhood, this beautiful and quaint property offers a serene retreat for guests. The bedrooms feature a comfortable king bed and a cozy twin bed, ensuring ...

$3,000
$3,000
Available: Right Now
This Spring Valley Home has Breathtaking views of Spring Valley Lake. This 3 bedroom 3 bath home has everything you need to a 4 car garage to a spacious backyard. All rooms are spacious and 2 separate living rooms on the 1st floor and 2nd floor. This...
$1,660
$1,660
Available: 19/07/2024
Amazing 2-bedroom, 1 bathroom apartment in Apple Valley. Amenities included: Outdoor patio area. Fresh paint throughout, new blinds. Central air, Central heat. Onsite laundry room. Parking. Utilities included: water. Is not pet friendly. 00 and a sec...

$1,500
$1,500
Available: Right Now
Welcome to this charming 2 bedroom, 1 bathroom home located in Apple Valley, CA. This cozy house features beautiful wood flooring throughout, indoor laundry, a swamp cooler to keep you cool during the warmer months, a fireplace for added ambiance, an...

$2,300
$2,300
Available: Right Now
Located in the Spring Valley Lake community, the house has 3 bedrooms and 2.5 bathrooms with 2185 Sqft. A beautiful tiled entry to the spacious living room. New carpet and patterned tile floor throughout the home. Open floor plan: Carpeted living are...
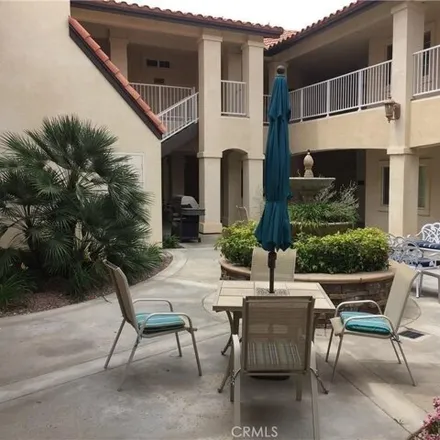
$1,695
$1,695
Available: Right Now
Brookhollow Community is a Desirable age 55+ Community. Wonderful location in Apple Valley Jess Ranch, and great condo's to live in. This condo is located on the first floor, PLUS,water and HOA fee(s) paid by the owner. This peaceful community...

$1,700
$1,700
Available: 08/07/2024
This charming newly renovated apartment features 2 Master Bedrooms with Walk in Closets and 2 Modern Bathrooms with updated fixtures. The living space is open and inviting with updated flooring and freshly painted cabinets throughout the whole apartm...

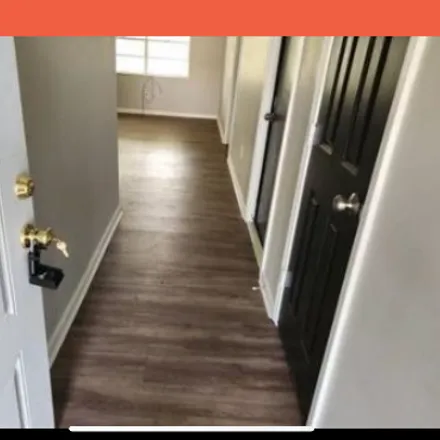
$1,500
$1,500
Available: Right Now
Exceptional apartment, ideally situated in close proximity to shopping centers, schools, and the 15 Freeway, offers unparalleled convenience. Recently undergoing a comprehensive remodel, this unit is in pristine, like-new condition, boasting generous...

$1,800
$1,800
Available: Right Now
Lovely Remodeled Unit for Rent in Duplex in Apple Valley. Unit #2 Features approx. 848 Sq. Ft., 2 Bedrooms, 1 Bathroom. Separate Laundry Hook-ups, Water Heater, Electric and Gas Meter. New quality Vinyl Flooring, New Interior Doors, Crown Molding, an...
$2,400
$2,400
Available: Right Now
This Spring Valley Lake beauty is an Oasis in the Desert. Featuring 4 spacious Bedrooms 2 Bathrooms with a step down living room, step up dining room and a family room with a comfy large fireplace for those cool evenings. Kitchen is appointed with st...
$2,295
$2,295
Available: Right Now
This newly remodeled 3 bedroom 2 bathroom house is located in the very quiet neighborhood of Bayridge with a new park close by! This house has new appliances, split floor plan, 2-car garage and a cozy screened in porch in the fenced backyard. Located...

$2,600
$2,600
Available: Right Now
Beautiful home 3 bedroom 2 bathroom ready for a big or small family, home is located in the desirable city of Apple Valley. Centrally located and just across the way from shopping centers and schools right near by, makes this home a commuter's DREAM!...
Apple Valley
Apple Valley, CA has a population of 71,916, while the median age is 37. The household income in Apple Valley, CA is around $50,907. The homeownership rate among the residents is 65%. The median residential property value in Apple Valley, CA that you should keep in mind is $215,800.
| Population | 71,916 |
| Median Age | 37.2 |
| Poverty Rate | 18% |
| Household Income | $50,907 |
| Number Of Employees | 25,484 |
| Median Property Value | $215,800 |
What is the Average Rent for Apple Valley, CA Apartments?
The average rent for apartment in Apple Valley, CA: $1,861
(-1.8%)
| Month | Median Price |
|---|---|
| Jun 2024 |
$1,533
|
| May 2024 |
$1,557
|
| Apr 2024 |
$1,512
|
| Mar 2024 |
$1,512
|
| Feb 2024 |
$1,512
|
| Jan 2024 |
$1,512
|
| Month | Median Price |
|---|---|
| Jun 2024 |
$1,861
|
| May 2024 |
$1,896
|
| Apr 2024 |
$1,907
|
| Mar 2024 |
$1,907
|
| Feb 2024 |
$1,907
|
| Jan 2024 |
$1,907
|
Be informed and make custom offers based on median rent prices. However, keep in mind that the price may vary depending on the size and amenities of the apartments for rent.
Renter's FAQ About Apple Valley, CA
-
What types of properties are available for rent in Apple Valley, CA?
In Apple Valley, CA, you can find a variety of rental properties including houses, apartments, rooms, and condos.
-
What amenities are commonly offered in rental properties in Apple Valley?
Rental properties in Apple Valley often come with amenities such as air conditioning, parking spaces, dishwashers, fireplaces, and access to pools.
-
Is Apple Valley a good place for students to find rental apartments?
Apple Valley is a great place for students to find rental apartments. With several educational institutions in the area, including Victor Valley College, students can easily access nearby educational opportunities while enjoying a peaceful suburban setting.
-
Does Apple Valley have a good walkability score?
Apple Valley is a suburban community that is more car-dependent, so the walkability score may not be as high compared to urban areas. However, there are still areas within Apple Valley that offer walkable amenities such as parks, shopping centers, and dining options.