Bedford, TX, USA apartments for rent
$7,140
$7,140
Available: Right Now
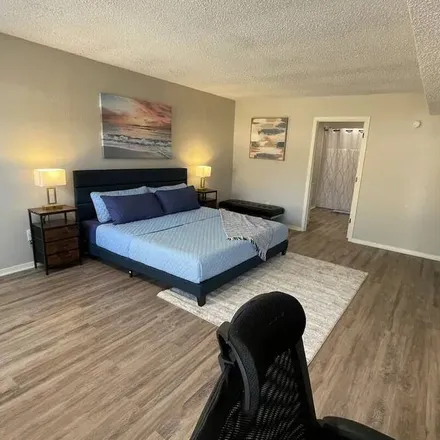
Come relax, enjoy time with family/friends, or position yourself in the most centralized home in DFW. Our peaceful and clean home brings a variety of relaxation, entertainment, family-friendly, and convenience.Our home provides a safe place to st...
$6,750
$6,750
Available: Right Now
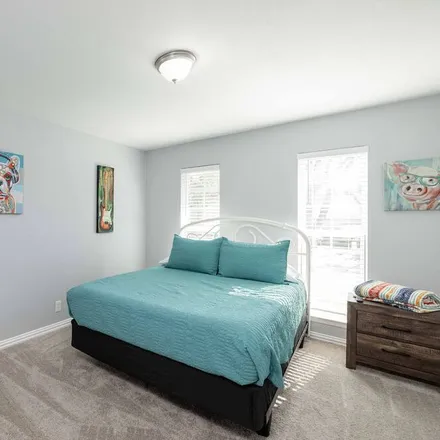
You and your guests will enjoy easy access to everything from this centrally located place.Home located minutes away from various attractionsDFW Airport: 12 milesAT&T Stadium: 10 milesGlobe Life Park: 13 milesSix Flags: 14 miles...

$2,700
$2,700
Available: Right Now
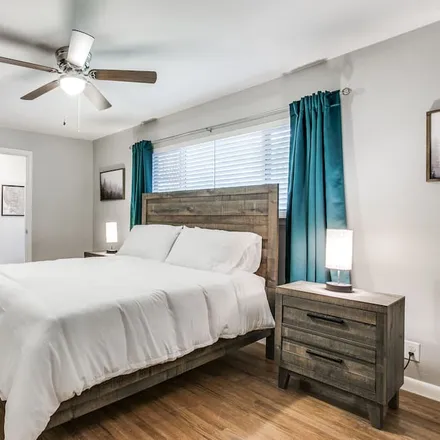
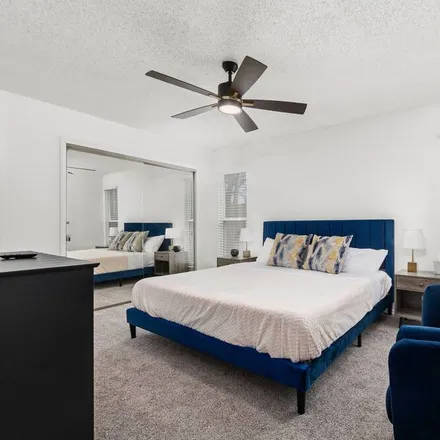
Beautiful one story home on a corner lot! Gorgeous kitchen features plenty of cabinet space, decorative backsplash and a breakfast nook. Family room features neutral colors and a cozy fireplace. Spacious master bedroom with a high ceiling. Master bat...
$13,920
$13,920
Available: Right Now
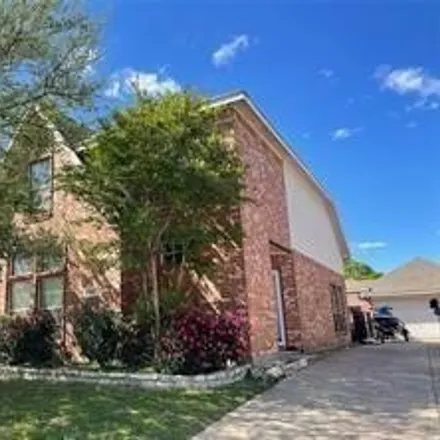
Come stay with us in our entertainment filled 4 bedroom 2 bathroom home! We have two separate game rooms that are perfect for making memories with your friends and family. We have a lovely patio with outdoor furniture and a beautiful pool to enjoy! W...

$1,675
$1,675
Available: Right Now
Ready for move-in. Beautiful fourplex unit with easy access to DFW airport and shopping. Siltstone Quartz countertop kitchen, solid surface range, microwave, refrigerator and new washer and dryer Two large bedrooms upstairs with large closets. Each b...

$2,200
$2,200
Available: Right Now
This 1-level 3 bedroom, 2 bath home has received a makeover and is in move-in condition. Fresh paint, laminate flooring, and updated lighting. Kitchen features stainless steel appliances, gas 5-burner range, white cabinets, laminate countertops, and ...
$2,550
$2,550
Available: Right Now
Come see this beautiful home in the Rustic Woods subdivision with convenient access to highway 121! Amazing home features 3 spacious bedrooms with the master downstairs and an additional half bath, dramatic staircase, high vaulted ceilings, open conc...

$2,750
$2,750
Available: Right Now
Stunning 2-story 3-3-2 in gated Bedford community ready for immediate occupancy! The main entrance, set alongside a nicely landscaped walkway, leads to an elegant formal dining area. Adjacent is an inviting living area featuring a beautiful fireplace...

$3,450
$3,450
Available: Right Now
Welcome to your dream rental in North Bedford! This spacious and impeccably maintained garden home on a corner lot offers elegance and comfort. The stunning stone and brick exterior and elegant 8ft iron, wood, and glass door create a grand entrance. ...

$3,200
$3,200
Available: Right Now
Welcome to this stunning 3 bedroom, 2 bathroom home located in a gorgeous tree lined gated community in Euless. This home features an open floor plan with granite countertops and stainless steel appliances in the kitchen. Enjoy the luxury of a garden...
$8,550
$8,550
Available: Right Now
Your family and friends will be close to everything when you stay at this centrally-located home hosted by superhosts! Cook a meal and stay in with games and entertainment, or, take a quick drive to nearby Grapevine, Arlington, Dallas, or Fort Worth....

$2,550
$2,550
Available: Right Now
Located in a Cul-de-Sac and well established quiet neighborhood. Spacious, meticulously maintained oversized lot with mature trees. Open floor plan overlooking a large glass sunroom. Neutral and warm color palette, vaulted and beamed ceiling, and an ...

$1,049
$1,049
Available: Right Now
Experience an elevated lifestyle in this stunning Bedford community! Nestled in the heart of Bedford, Texas, this charming apartment community offers everything you need for a vibrant lifestyle. Enjoy convenient access to a variety of shopping, dinin...

$2,495
$2,495
Available: Right Now
Nice 1 Story House in Bedford Cute 1 story house in Bedford. HEB ISD.This house has 1 large living area in the front of the house with a fireplace and formal dining area. The kitchen has lots of cabinets and counter space. Newer vinyl plank in living...

$2,795
$2,795
Available: Right Now
Simply beautiful! Wonderful location with 4 bedrooms plus office. First floor is all rich hardwood floors, beautiful quartz kitchen countertops, all new kitchen appliances including a brand new stainless steel fridge, 15 seer ac unit to save on your ...

$2,400
$2,400
Available: Right Now
Ready for New Tenant walking distance to Boys Ranch Park . : - open floor plan with high ceiling, ample natural lights in every rooms and Community pool ! Beautiful Arched Windows and Laminate Flooring In Formal Dining, Living Areas, Ha...
$955
$955
Available: 15/06/2024
Receive up to $600 cash rebate when you lease this apartment with us!! Contact Find1Rent1.com for Exclusive Online ONLY Special #2125 – We provide a 100% Free Service to find the best place for your budget. Considering a different property? Ca...
$1,449
$1,449
Available: Right Now
Experience an elevated lifestyle in this stunning Bedford community! Nestled in the heart of Bedford, Texas, this charming apartment community offers everything you need for a vibrant lifestyle. Enjoy convenient access to a variety of shopping, dinin...
$2,400
$2,400
Available: Right Now
Beautifully updated home - kitchen and bathrooms updated. Great open floor plan, all bedrooms upstairs. Great schools. Close to shopping and easy access to highways for easy commute. Your family is going to feel right at home here. From the fantastic...

$2,100
$2,100
Available: Right Now
Welcome to your new home! This pristine 3-bedroom, 2-bath residence is ready for immediate move-in. The house features brand-new floors throughout, enhancing its charm. The kitchen comes equipped with a high-end refrigerator. Additionally, a washer a...

$2,500
$2,500
Available: Right Now
Refrigerator, washer, dryer, and all appliances included ! No carpet ! Welcome to this light and bright open concept home in a very convenient area to get across DFW. Newer shaker cabinets, quartz countertops, gas range, walk-in shower,...

$3,450
$3,450
Available: Right Now
Absolutely stunning 4-3-2 nestled at end of cul-de-sac in Bedford Estates! Meticulously maintained both inside and out. Tall ceilings and tons of natural light flood this beautifully updated home. Formal dining area off front entry. Inviting living a...
Bedford
Bedford, TX has a population of 49,082, while the median age is 40. The household income in Bedford, TX is around $64,933. The homeownership rate among the residents is 55%. The median residential property value in Bedford, TX that you should keep in mind is $179,600.
| Population | 49,082 |
| Median Age | 40.3 |
| Poverty Rate | 6% |
| Household Income | $64,933 |
| Number Of Employees | 26,942 |
| Median Property Value | $179,600 |
What is the Average Rent for Bedford, TX Apartments?
The average rent for apartment in Bedford, TX: $2,582
(-23.9%)
| Month | Median Price |
|---|---|
| Jun 2024 |
$2,124
|
| May 2024 |
$2,922
|
| Apr 2024 |
$2,993
|
| Mar 2024 |
$2,993
|
| Feb 2024 |
$2,993
|
| Jan 2024 |
$2,993
|
| Month | Median Price |
|---|---|
| Jun 2024 |
$2,582
|
| May 2024 |
$3,392
|
| Apr 2024 |
$2,888
|
| Mar 2024 |
$2,888
|
| Feb 2024 |
$2,888
|
| Jan 2024 |
$2,888
|
Be informed and make custom offers based on median rent prices. However, keep in mind that the price may vary depending on the size and amenities of the apartments for rent.
Renter's FAQ About Bedford, TX
-
How can I find apartments for rent in Bedford, TX?
There are several ways to find apartments for rent in Bedford, TX. You can search online on rental platforms or use local real estate agencies. Networking with friends, family, and coworkers is another effective way to discover available rentals. Additionally, you can drive around the neighborhood and look for "For Rent" signs.
-
What are the most popular types of properties for rent in Bedford, TX?
The most popular types of properties for rent in Bedford, TX are houses, apartments, townhouses, and condos. Each type offers different amenities and features, so it's important to consider your preferences and requirements before making a decision.
-
What amenities are commonly available in apartments for rent in Bedford, TX?
Apartments for rent in Bedford, TX often come with a range of amenities. Common amenities include a dishwasher, parking space, air conditioning, fireplace, and garden. However, it's important to note that not all apartments may offer every amenity, so it's advisable to list your must-haves before starting your search.
-
What should pet owners know when renting an apartment in Bedford, TX?
Pet owners should be aware that not all rental properties in Bedford, TX allow pets. Some landlords may have specific pet policies in place, such as breed restrictions or additional pet deposits. It's important to communicate your pet ownership upfront and inquire about any pet-related rules or fees when searching for rentals.