Belmont, MA, USA apartments for rent

$2,900
$2,900
Available: Right Now
Look no further! Discover this exceptional 3-bedroom, 1-bathroom penthouse residence nestled in the heart of Belmont. Boasting over 1000 sqft of living space, this home features warmth, charm, and timeless character with its high ceilings, and hardwo...

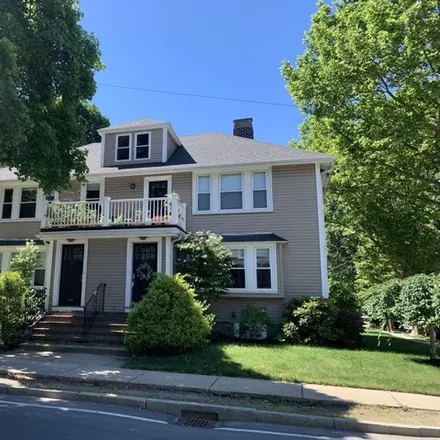
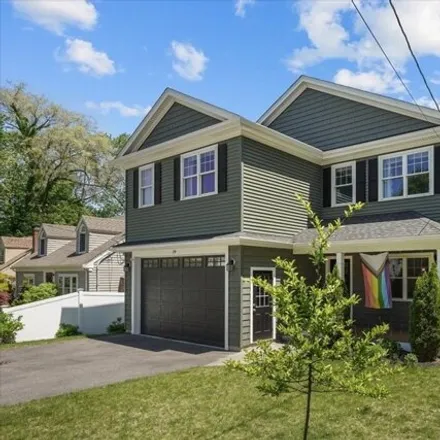
$6,500
$6,500
Available: Right Now
Open house june 24 5-6pm ! This pristine colonial, partially furnished, with handsome curb appeal offers a floor plan with plenty of space to spread out. The first floor features a large front to back living room with fireplace, large sunroom ...
$3,500
$3,500
Available: Right Now
Modern 1st floor 3 bedroom, 1 bath unit. Spacious and bright living room with recessed lighting and fireplace(decorative), formal dining room with built-in, custom tiled bath, modern eat-in kitchen with granite countertops, stainless steel appliances...

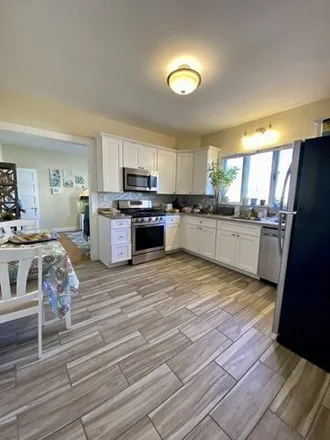
$4,200
$4,200
Available: Right Now
Lovely single house for rent in Belmont located next to Claypit Pond and Belmont High School. The unit featuring hardwood floor with 3 bedrooms and 1.5 bath and a 4-seasoned room, which can be used as family room or office. Very close to multiple MBT...
$3,800
$3,800
Available: Right Now
-- 2 off street parking----free laundry---- Available: 9/1/2024--Gut renovated, charming 1st floor 3 bed + 2 bath apartment. Located in the coveted neighborhood of East Watertown (Watertown/Cambridge line) centered around the Oakley Country Cl...

$5,640
$5,640
Available: Right Now
[Please carefully review the description before booking]Basement Studio | Renovated Space | High speed internet | W/D | Parking | No Pets Sleeping arrangement: 4 guests maxOne (1) Queen bedOne (1) Pull out sofa bed almost que...

$2,900
$2,900
Available: Right Now
This bright and spacious unit is located on the 2nd and 3rd floors of a two family home and boasts gorgeous hardwood floors, high ceilings, original wood work, a spacious open living room / dining room with brick fireplace, decorative lighting and bi...

$3,600
$3,600
Available: Right Now
Light-filled, spacious2, 000sqft townhome with in-unit laundry, 3 bedrooms and 2 full baths on the 2nd and 3rd floors of a well maintained 2-family home in a superb location with beautiful backyard landscaping and a private back porch. Hardwood floor...

$6,250
$6,250
Available: Right Now
Discover the warmth of 265 Grove St, located on the Cambridge/Belmont line. This cozy, fully furnished home offers1, 770sq ft of inviting living space. The heart of the home is the fully equipped kitchen with a cooktop, wall oven, dishwasher, fridge,...

$2,000
$2,000
Available: Right Now
Sparkling one- bedroom apartment on the garden level of a well-maintained brick building in a great Watertown location. Tenant to pay electricity and gas for heat, hot water and stove. Driveway parking for one vehicle. Landlord requires 1st, last and...

$3,200
$3,200
Available: 01/08/2024
Beautifully renovated townhouse on Manning Road in Waltham. Right off of Trapelo Road. About a ten minute walk from Waverley Station Commuter Rail as well as the #73 bus line into Harvard Square. Easy access to I-95 and Route 2. 2 Bedrooms with en-su...

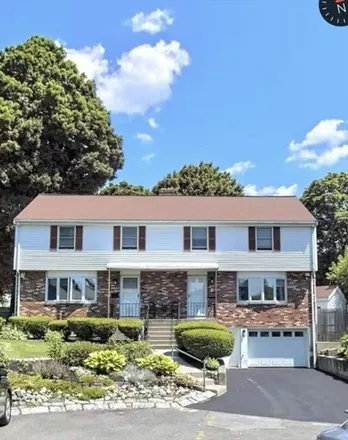
$13,000
$13,000
Available: Right Now
This 2010 build is nestled on a corner lot adjacent to Belmont Country Club. With 5 beds, 3 full baths, 2 half baths, and a gracious layout it will fit all your needs. The home welcomes into a foyer with two large coat closets and a half bathroom off...
$3,500
$3,500
Available: Right Now
Available for July1, 2024! Amazing 3 bedroom 1 bath Duplex style features eat-in-kitchen with dishwasher/disposal, gas stove, sunny living room with huge bay window, dining room with wall A/C, hardwood floors throughout, three bedrooms and bath on se...

$4,800
$4,800
Available: Right Now
Available September 1st ! This stunning 4-bedroom, 3.5-bath Cape located in Watertowns desirable West End. On first floor you can enjoy a bright, sunny living room with a gas fireplace, open to a dining area with doors leading to a nice deck. Upstair...

$9,900
$9,900
Available: Right Now
Welcome to this stunning contemporary home available for lease starting Aug 15th! A world-famous architect thoughtfully designed the massive 2007 addition to embrace the beautiful natural setting. From the garage and carport, you will enter into the ...

$2,700
$2,700
Available: Right Now
Well maintained townhouse available for rent in cul-de-sac of the highly desirable Village Condominiums. Over three levels of living space, this unit offers gleaming hardwood floors, in unit laundry and central air. Recent improvements include update...
$4,000
$4,000
Available: Right Now
Brightly renovated 3 bed 1.5 bath classic center entrance colonial-style house in East Arlington available July 1. Open concept first floor containing: A front to back living room with plentiful windows providing abundant natural light; brand new kit...

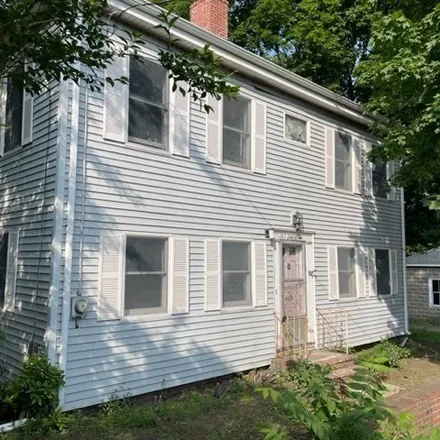
$3,990
$3,990
Available: Right Now
Entire rental unit in Belmont, Massachusetts2 guests2 bedrooms2 beds1 bathEntire rental unit in Belmont, Massachusetts2 guests2 bedrooms2 beds1 bathWhat this place offersBathroomHot waterBedroom and laundryEssentials...

$4,200
$4,200
Available: Right Now
Sophisticated Renovation of a Belmont Classic. This refined 2nd and 3rd floor 3 bedroom with private entrance must be seen in person. Spacious and gracious with seamless transitions throughout. Generously sized living room with a/c, bonus room and di...

$2,600
$2,600
Available: Right Now
Great 2 bedroom 1 bathroom plus office on Trowbridge St in Belmont close to Concord Ave in Cambridge. Enjoy gorgeous hardwood floors throughout this incredibly spacious and well maintained property! Updated kitchen and bathroom, deck, shared yard and...
$8,000
$8,000
Available: Right Now
Experience top-notch comfort and style in this brand new, high build-quality, fully furnished home. The first floor features an amazing open floor plan with a large granite island that flows into a bright living room with a gas fireplace and a classy...

$3,300
$3,300
Available: Right Now
This 3-bedroom unit located on Thingvalla Ave in West Cambridge's Strawberry Hill on the Belmont line. On the front side of the house and an enclosed Porch that runs off of the Living Room. Shared yard and garden. Driveway parking is Tandem. Enclosed...
Belmont
Belmont, MA has a population of 25,965, while the median age is 42. The household income in Belmont, MA is around $118,370. The homeownership rate among the residents is 63%. The median residential property value in Belmont, MA that you should keep in mind is $759,500.
| Population | 25,965 |
| Median Age | 41.6 |
| Poverty Rate | 6% |
| Household Income | $118,370 |
| Number Of Employees | 13,184 |
| Median Property Value | $759,500 |
What is the Average Rent for Belmont, MA Apartments?
The average rent for apartment in Belmont, MA: $3,144
(-11.5%)
| Month | Median Price |
|---|---|
| Jun 2024 |
$1,605
|
| May 2024 |
$2,706
|
| Apr 2024 |
$3,065
|
| Mar 2024 |
$3,065
|
| Feb 2024 |
$3,065
|
| Jan 2024 |
$3,065
|
| Month | Median Price |
|---|---|
| Jun 2024 |
$3,144
|
| May 2024 |
$3,551
|
| Apr 2024 |
$3,013
|
| Mar 2024 |
$3,013
|
| Feb 2024 |
$3,013
|
| Jan 2024 |
$3,013
|
Be informed and make custom offers based on median rent prices. However, keep in mind that the price may vary depending on the size and amenities of the apartments for rent.