Benbrook, TX, USA apartments for rent
$3,150
$3,150
Available: Right Now
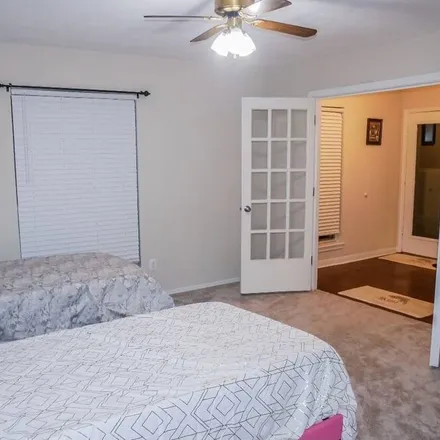
Charming Condo, 3 Bedroom and 2.5 Bath in Fort Worth. The house features Master bedroom has vaulted ceilings, luxurious master bath with dual sink vanity, spa shower, tub, huge walk in closet. Light-filled game room separates master suite from other ...

$2,400
$2,400
Available: Right Now
Beautiful move-in ready home in the desirable Oakmont Meadows! This spacious4BR, 2BAhome features open concept with kitchen overlooking the large family room, high ceilings and gas fireplace. Floor plan is ideal for entertaining and has lots of windo...
$4,770
$4,770
Available: Right Now
Welcome to the Captain’s Cottage! An open concept, sunny private home with your own private Hot Tub to relax and unwind.Only 8 minutes to Downtown Fort worth and ducky’s arina ,via the Chisholm Trail. Only 30 min to cowboy stadumThis corn...

$4,170
$4,170
Available: Right Now
Your next fun-filled Texas adventure awaits at this modern 2-bedroom, 2-bathroom vacation rental in Benbrook! This apartment features a comfortable living space with a Smart TV, a fully equipped kitchen for preparing home-cooked meals, and an excepti...
$2,053
$2,053
Available: Right Now
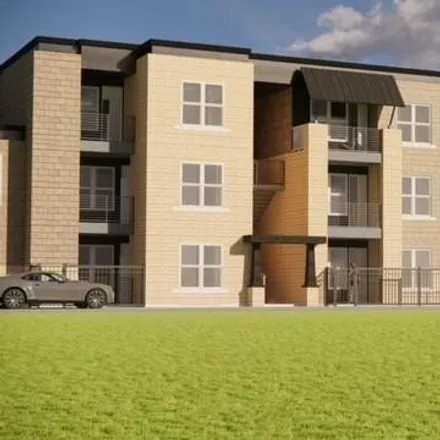
Coming soon the end of december !!! Your Dream Home Awaits in the Medical District and close to Chisholm Trail!! The preleasing start date is HERE! Fort worth meadows apartments embody green, healthy living. Come experience a unique amb...

$1,250
$1,250
Available: Right Now
Move in special $200 off first months rent if move in by july 4th ! 2Bd 2Ba Duplex ready to move in. Well updated with plenty of living space and conveniently located in downtown Benbrook. Assigned covered parking with storage. Featuring new t...

$2,150
$2,150
Available: Right Now
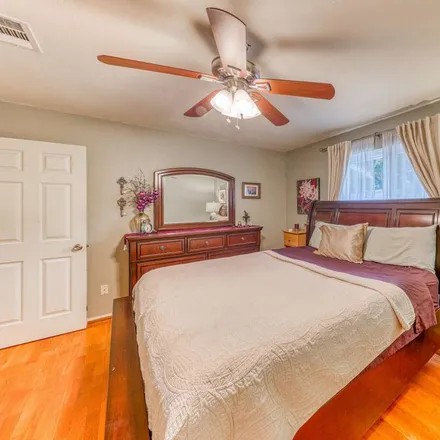
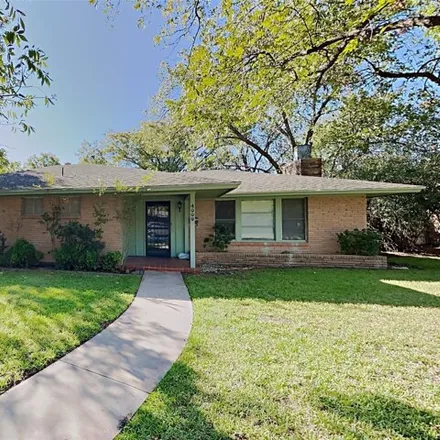
Nice updated home! Waverly Park Elementary!! Very large open living area to dining area with New flooring. Built in bookshelves in living. Kitchen has good counter space and tile. Hall bath is updated with lots of built in cabinets. Master bedroom ha...
$5,400
$5,400
Available: Right Now
Relax with the whole family at this peaceful place to stay . spacious, top floor three bedroom - two bath nestled within Ridglea Country Club Estates! One of the largest floor plans available in this golf-course community-complex Beautiful nat...
$4,200
$4,200
Available: Right Now
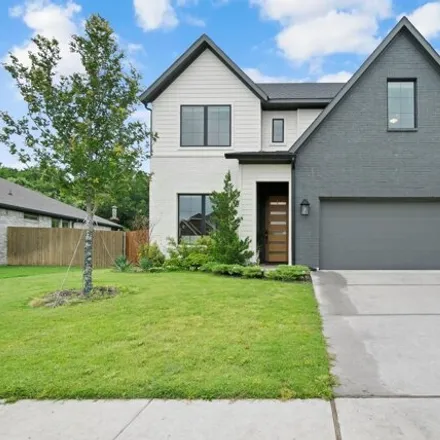
Experience the allure of this charming modern farmhouse situated on a premium lot with maximum backyard privacy and an excellent location. Built in 2021, this well-loved home is a stunning example of attention to detail. The open-concept living area ...
$1,400
$1,400
Available: Right Now
Cozy 2 bed 1 bath back house located in the sought after Ridglea Hills neighborhood. Home has a beautiful backyard oasis to unwind after a long day. All utilities and lawn care included. Washer and Dryer included in a shared space. You'll enjoy easy ...

$3,195
$3,195
Available: Right Now
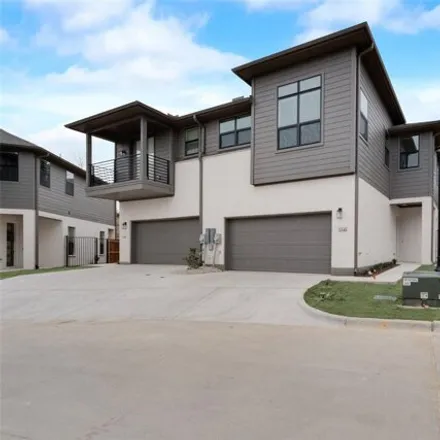
This beautiful home offers 4 bedrooms 4.5 bathrooms 2 living areas, breakfast bar, dinning room, study and an oversized garage. Located on a corner lot this home has beautiful luxury vinyl plank flooring though out the home. Large chefs kitchen with ...

$1,550
$1,550
Available: Right Now
Stunning country club setting! This updated upstairs condo features 1 bedroom and 1 bathroom, with a spacious living and dining room combo. The kitchen comes fully equipped with all appliances, including a refrigerator and built-in microwave. Enjoy c...

$1,550
$1,550
Available: Right Now
Charming and beautifully updated two-bedroom townhome, perfect for modern living. Step inside to find a bright and airy open-concept living space, designed for both comfort and style. The kitchen features stunning granite countertops, sleek cabinetry...

$1,550
$1,550
Available: Right Now
Charming one-bedroom, one-bathroom layout that exudes coziness and warmth. Its prime location right across from the prestigious Ridglea Country Club Golf Course offers stunning views and a serene setting. Convenience is key, with abundant shopping an...
$1,250
$1,250
Available: Right Now
Move in special $200 off rent if move in by jan. 1. Looking for a charming and updated rental unit in a great location? Look no further than our newly available unit! We have a downstairs unit available that has a small fenced in yard. This pr...
$700
$700
Available: Right Now
Room for Rent in Fort Worth: A Quiet, Professional Living Space. Seeking a peaceful and professional tenant to join our quiet Fort Worth home.Property Highlights:The home includes keyless front door entry, keyed doorknob for your room for pri...

$2,999
$2,999
Available: Right Now
Ample living space with an open layout in the kitchen and living room area are great features for this home in Ft. Worth! Situated in a newly developed neighborhood. Media Room is fully insulated, pre-wired with surround sound. All kitchen appliances...
$1,975
$1,975
Available: Right Now
Immerse yourself in the charm of this elegant 1628 square foot single-family home, nestled in the sought-after neighborhood of Fort Worth, TX. Located at 4008 Cartist Dr, this property embodies comfort and style with 2 generously sized bedrooms and 2...

$1,450
$1,450
Available: Right Now
Nestled in the tranquil golf course community of Ridglea Country Club, this fantastic condo community offers easy access to dining, shopping, and ALL of Fort Worth's many attractions and activities. Enjoy the enormous pool and clubhouse and long walk...

$1,250
$1,250
Available: Right Now
Welcome to your charming 2-bedroom, 2-bathroom duplex nestled in the heart of Benbrook. This delightful home boasts a cozy wood-burning fireplace, perfect for those chilly evenings. The spacious layout includes a convenient carport, ensuring ample pa...
$2,088
$2,088
Available: Right Now
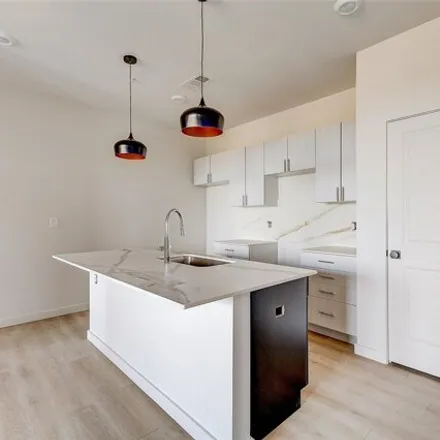
Pre-leasing ! Brand new, exquisitely designed apartment community offering a variety of floor plans. Introducing the innovative ORI transitional room system maximizing space utilization for unparalleled adaptability. Need an office, but don't ...

$2,000
$2,000
Available: Right Now
What a great place to live in fabulous Ridglea Hills! Ridglea Hills Elementary! Beautiful cottage surrounded by huge oak trees. Recently updated complete with new carpeting. Duplex consists two separate homes, a front house (6471) and a back house (6...
Benbrook
Benbrook, TX has a population of 22,782, while the median age is 40. The household income in Benbrook, TX is around $69,885. The homeownership rate among the residents is 68%. The median residential property value in Benbrook, TX that you should keep in mind is $157,100.
| Population | 22,782 |
| Median Age | 40.3 |
| Poverty Rate | 6% |
| Household Income | $69,885 |
| Number Of Employees | 11,800 |
| Median Property Value | $157,100 |
What is the Average Rent for Benbrook, TX Apartments?
The average rent for apartment in Benbrook, TX: $1,887
(-26.3%)
| Month | Median Price |
|---|---|
| Jun 2024 |
$1,887
|
| May 2024 |
$2,561
|
| Apr 2024 |
$2,293
|
| Mar 2024 |
$2,293
|
| Feb 2024 |
$2,293
|
| Jan 2024 |
$2,293
|
Be informed and make custom offers based on median rent prices. However, keep in mind that the price may vary depending on the size and amenities of the apartments for rent.
Renter's FAQ About Benbrook, TX
-
What types of properties are available for rent in Benbrook, TX?
In Benbrook, TX, you can find a variety of rental options including houses, apartments, duplexes, condos, rooms, and townhouses to suit your needs and preferences.
-
What are some popular amenities available in rental properties in Benbrook, TX?
Rental properties in Benbrook, TX often come equipped with amenities such as air conditioning, dishwasher, parking facilities, fireplaces, and roof decks, to enhance your comfort and convenience.
-
What are the public transportation options in Benbrook, TX?
Benbrook, TX offers convenient public transportation options for residents. The T (Fort Worth Transportation Authority) provides bus services, connecting different parts of the city and neighboring areas. Additionally, there are various ridesharing services available for easy commuting.
-
Are there any additional fees associated with renting a place in Benbrook, TX?
While the specific fees may vary, you may come across additional costs such as application fees, pet deposits, and monthly maintenance fees in some rental properties in Benbrook, TX. It's important to clarify these details with the landlord or property management before signing a lease agreement.