Bourne, MA, USA apartments for rent

$2,300
$2,300
Available: Right Now
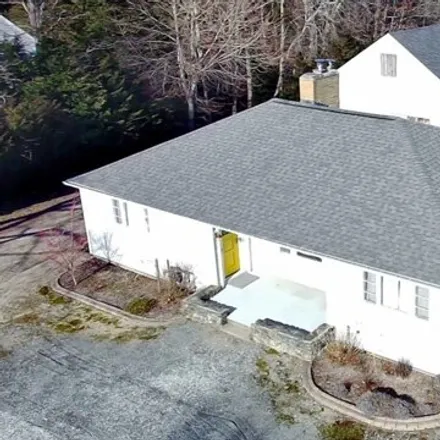
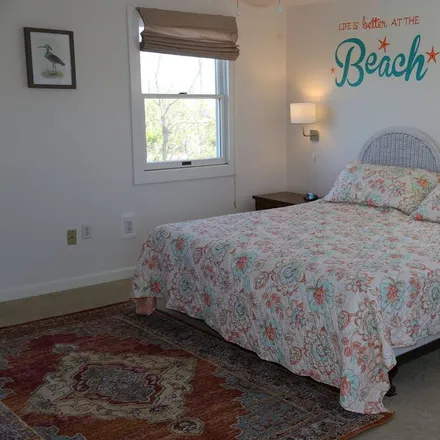
Winter rental only ! Located in Sagamore Beach. Less than 1/4 mile from the ocean. This contemporary , furnished, 4 bedroom home offers hardwood floors throughout, large eat-in kitchen/dining room. Nice open floor plan. Screened in porc...

$8,190
$8,190
Available: Right Now
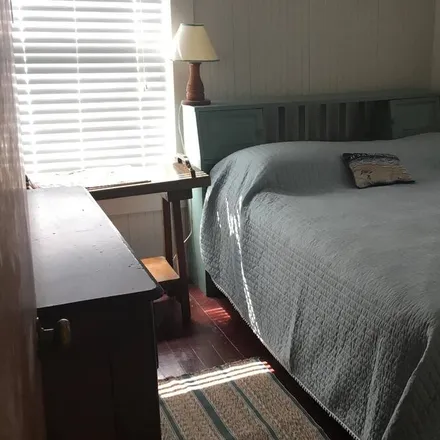
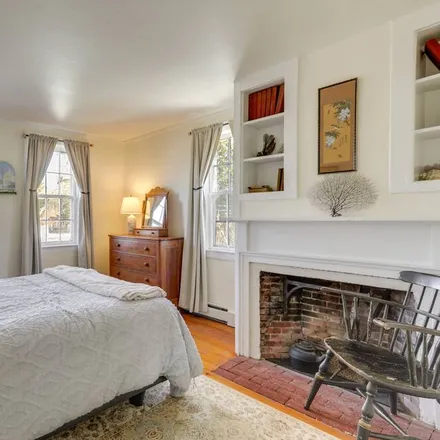
Escape to the Cape for a stay at this 2-bedroom, 1-bath vacation rental! This charming cottage features century-modern decor, a well-stocked kitchen, and a peaceful outdoor living space with a gas grill and hammock. Soak up the sun at Monument Beach,...

$14,280
$14,280
Available: Right Now
5 Bedroom - 3.5 Baths - Sleeps 10A 7-night Friday-to-Friday rental reservation is required during peak summer weeks. Guests can bring their own linens or rent from our Linen Service for an extra fee (Bed Sheets, Bath, Beach and Kitchen Towels...

$1,800
$1,800
Available: Right Now
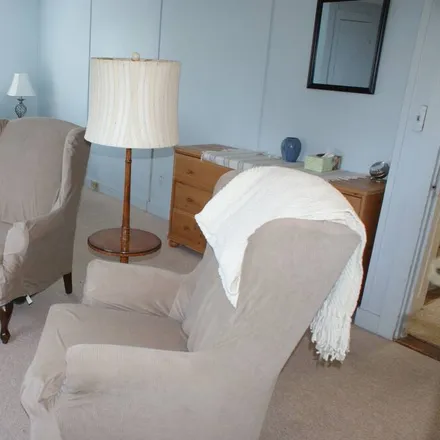
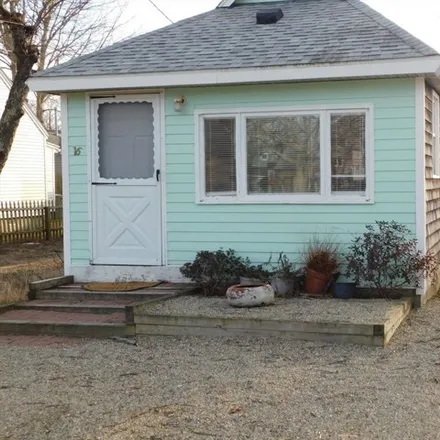
Winter rental onset. Available September15, 2024 -June14, 2025Classic ranch-style two bedroom, one bath home, great neighborhood, walk to association beach, short distance from the village. Hardwood floors, washer, dryer in basement, insulated...

$2,600
$2,600
Available: Right Now
A year round rental located at Garden Homes East. Open floor plan, 2 bedrooms, laundry area, full bath and shed. Ceramic tile kitchen floor, oak cabinets, natural gas stove, natural gas heat. Great location close to shopping, medical center, Onset Be...

$1,350
$1,350
Available: Right Now
Seasonal rental available Oct. 1 - April30, 2025.Located on Taylors Point, Spacious one bedroom home with open floor plan. One level living with cozy gas fireplace living room and large eat in kitchen. The laundry room is conveniently located off of ...

$3,800
$3,800
Available: Right Now
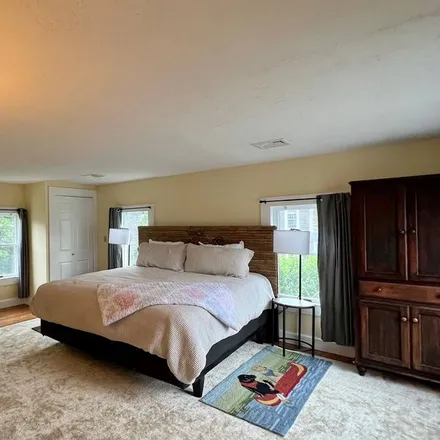
Hard to find year round rental. Beautiful fully furnished available September 15th! Totally renovated home located in the beautiful Handy Point neighborhood of Pocasset. The main level of this home offers an open floor plan with kitchen, living room ...

$6,420
$6,420
Available: Right Now
Summary:24005 -Summersault: Pond Front, 3 Min Drive to Old Silver Beach!The Space:Peace and quiet, sun and salt, rest and relaxation. You can have it all and more on your next vacation in Falmouth at Summersault. Stepping off of the p...
$2,000
$2,000
Available: Right Now
Charming single level rental in the quaint village of Cataumet, located in the town of Bourne. This property is close to public pickleball and tennis courts, and public beaches including the beautiful sand bars of Old Silver Beach. Theres plenty of p...
$14,340
$14,340
Available: Right Now
Two Floors of Beautiful Beachfront Summer Living Five bedroom, two bath, full kitchen home--steps to the beach. Our home is in a private setting with a large sunny deck and all the amenities for a great vacation. Two floors connected by outside s...

$1,500
$1,500
Available: Right Now
This is aWINTERrental available Oct 1- April30, 2025located on Taylor's Point near the Bourne bridge. This adorable, immaculate two bedroom, one bath home is fully furnished. Washer/dryer is located in the lower level. Property has a slight salt wate...
$14,070
$14,070
Available: Right Now
Megansett- North Falmouth, Multi weeks Available. Lovely Megansett Colonial next door to the North Falmouth Park, Playground, Sitting Park and Library. Walk only 3/10th of a mile to life guarded Megansett Harbor Beach or across the street to t...
$23,340
$23,340
Available: Right Now
6 Bedroom - 2.5 Baths - Sleeps 12A 7-night Saturday-to-Saturday rental reservation is required during peak summer weeks. Guests can bring their own linens or rent from our Linen Service for an extra fee (Bed Sheets, Bath, Beach and Kitchen To...

$17,280
$17,280
Available: Right Now
5 Bedrooms, Sleeps 82 Bathrooms7 Night Minimum Rental, Saturday - SaturdayAbout this home:Welcome to 34 Canal View Rd, a brand new vacation rental in Bourne, MA, available for the first time. This home features a fully-equipped kitche...

$7,980
$7,980
Available: Right Now
Pocasset Heights HideawayOur calendar is updated in real-time & our nightly rates are accurately displayed. Simply enter your desired dates and click 'Book Now!'Ideally located near the shore and cute as can be, this Bourne cottage is Cape Co...
$9,510
$9,510
Available: Right Now
3 Bedroom - 1 Bath - Sleeps 6A 7-night Saturday-to-Saturday rental reservation is required during peak summer weeks. Guests can bring their own linens or rent from our Linen Service for an extra fee (Bed Sheets, Bath, Beach and Kitchen Towels...
$11,520
$11,520
Available: Right Now
Get the most out of your next Atlantic adventure when you stay at this beautiful Pocasset vacation rental! With a charming interior, furnished porch, and great location just a short walk from the shores of Barlows Landing Beach, this 5-bedroom, 2-bat...

$13,680
$13,680
Available: Right Now
4 Bedroom - 2.5 Baths - Sleeps 8A 7-night Saturday-to-Saturday rental reservation is required during peak summer weeks. Guests can bring their own linens or rent from our Linen Service for an extra fee (Bed Sheets, Bath, Beach and Kitchen Tow...

$13,620
$13,620
Available: Right Now
4 Bedroom - 2 Baths - Sleeps 9A 7-night Friday-to-Friday rental reservation is required during peak summer weeks. Guests can bring their own linens or rent from our Linen Service for an extra fee (Bed Sheets, Bath, Beach and Kitchen Towels)...

$4,200
$4,200
Available: Right Now
This gorgeous custom home in Gray Gables is available for rent from September through May! Water views from nearly every room, and steps to the deeded private beach and some of the best shellfishing spots. The open floor plan offers plenty of natural...

$12,120
$12,120
Available: Right Now
3 Bedrooms, Sleeps 72 Bathrooms7-Night minimum rental, Saturday - SaturdayAbout this home:Enjoy our single family air-conditioned home and the beautiful views of Buzzards Bay while vacationing in lovely Pocasset Village. You can spend...
$3,800
$3,800
Available: Right Now
Lovely Winter and Summer weekly Rental with a minimum of a 30 Day stay Minimum, This Water view home sleeps four. Large open living room with amazing water views. Has full bath with washer/dryer. Very comfortable living room with pull out couch which...
Bourne
Bourne, MA has a population of 1,270, while the median age is 53. The household income in Bourne, MA is around $58,192. The homeownership rate among the residents is 81%. The median residential property value in Bourne, MA that you should keep in mind is $384,500.
| Population | 1,270 |
| Median Age | 53.2 |
| Poverty Rate | 4% |
| Household Income | $58,192 |
| Number Of Employees | 641 |
| Median Property Value | $384,500 |
Renter's FAQ About Bourne, MA
-
What types of properties are available for rent in Bourne, MA?
In Bourne, MA, you can find a variety of rental property types including houses, townhouses, and apartments. Whether you prefer a spacious house, a cozy townhouse, or a convenient apartment, there are options available to suit your preferences and budget.
-
What amenities are commonly available in rental properties in Bourne, MA?
Rental properties in Bourne, MA often come with popular amenities such as parking, air conditioning, dishwasher, garden, and fireplace. These amenities can enhance your comfort and convenience while living in the rental property of your choice.
-
Is Bourne, MA a suitable place for young families?
Absolutely! Bourne, MA is a family-friendly community that offers various amenities and activities suitable for young families. With excellent schools, parks, and recreational facilities, Bourne provides a safe and welcoming environment for children to grow and thrive.