Burleson, TX, USA apartments for rent
$2,325
$2,325
Available: Right Now
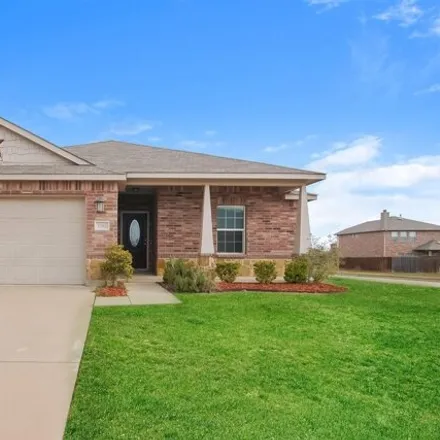
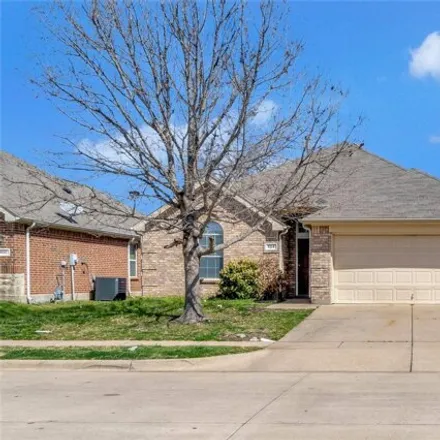
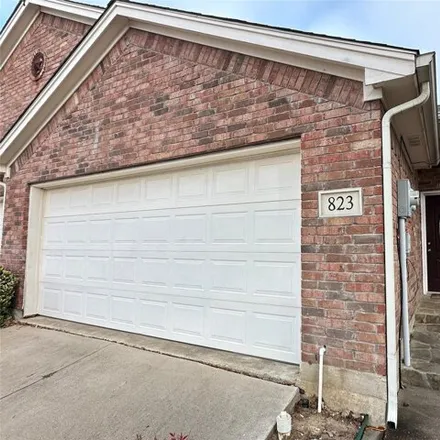
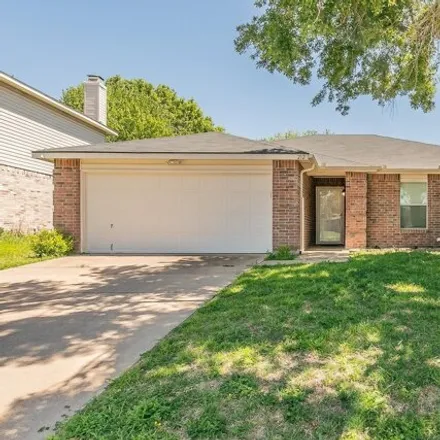
Adorable home ready for move in! This home offer 3 bedroom and 2 bathrooms located in beautiful place. In addition, this home features vinyl and carpeted floors, a modern kitchen with updated cabinets and offer plenty of counterspace. Home has 2 car ...
$2,495
$2,495
Available: Right Now
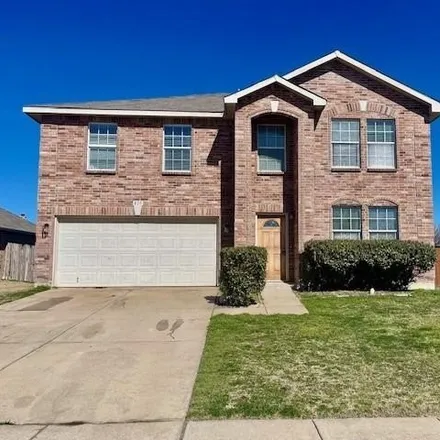
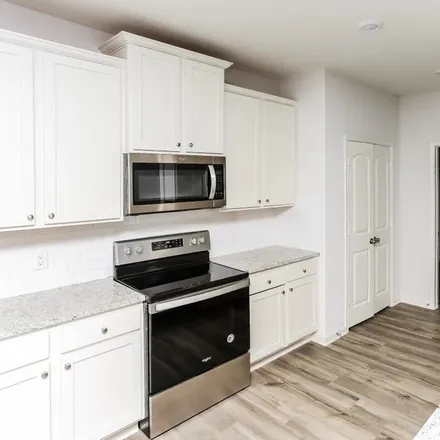
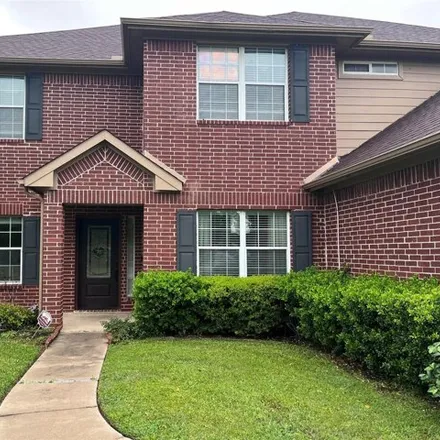
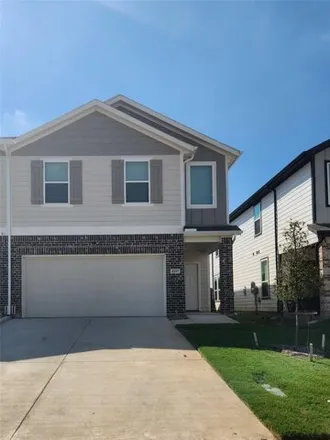
Nice 2 Story home in Burleson located on a premium oversized lot across from the greenbelt and hiking trails. Newer inside paint. 2 living areas and 2 dining areas, The back living area has a wood burning fireplace. The kitchen comes equipped with a ...
$1,725
$1,725
Available: Right Now
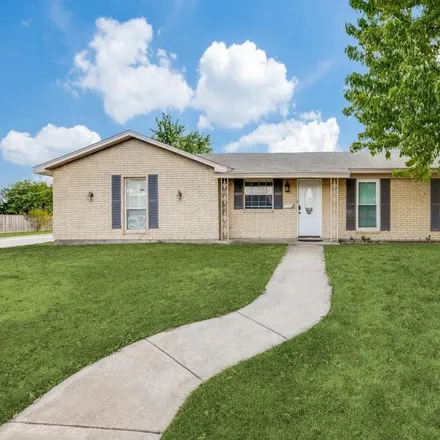
Cute 2-2 Single Family Residence located on a Court in Joshua. Great Joshua Schools- 1050 Sq Ftt This home is Brick and Siding-It was built in 2013. Composition Roof. Fenced Backyard-Dog Run-Concrete Floors and Granite Countertops-Electric Oven and D...
$2,275
$2,275
Available: Right Now
$2,100
$2,100
Available: Right Now
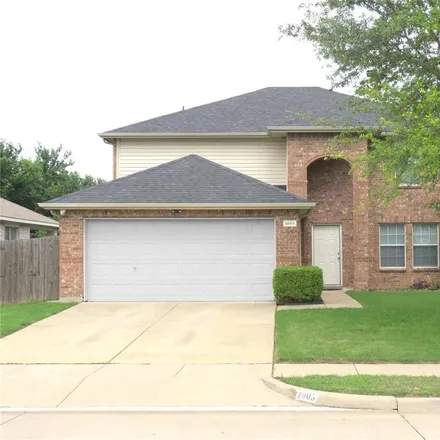
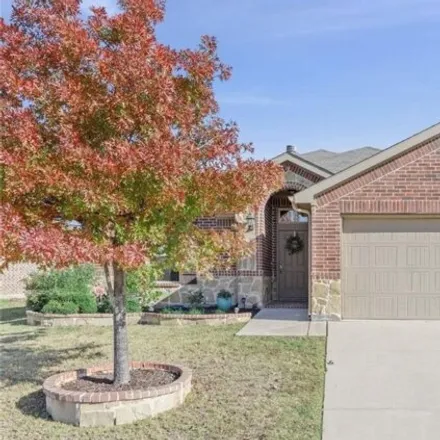
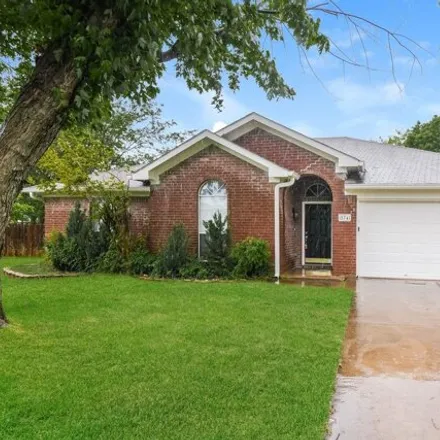
This charming home is nestled in a quiet neighborhood and boasts an open floor plan, great for entertaining and family gatherings. It comes with all appliances, including a refrigerator, a washer, dryer, and a living room TV. The attached 2-car garag...
$2,182
$2,182
Available: 01/04/2024
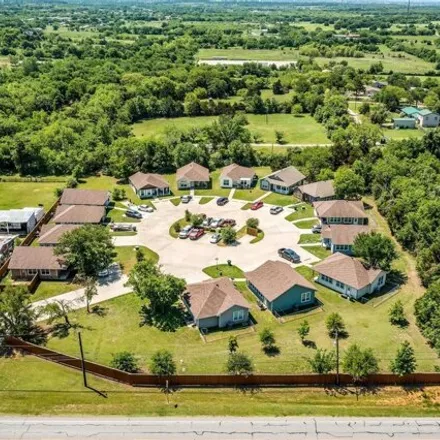
A serene community nestled south of Fort Worth, where every corner is a picture-perfect slice of tranquility. That's exactly what awaits you in Crowley, TX – our vibrant new neighborhood just waiting to welcome you home. Convenience? Check! With easy...
$2,450
$2,450
Available: Right Now
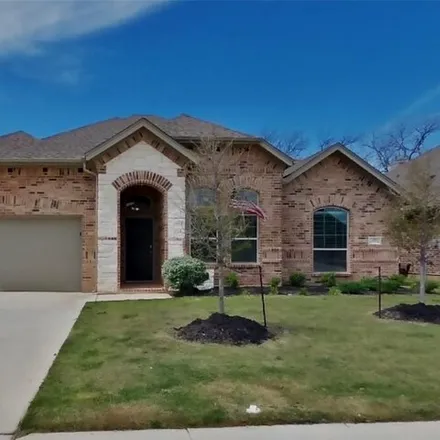
We've tailored a unique collection of features into a thoughtfully designed home 3 and 4 bedroom homes located in Crowley, TX. Our floorplans are designed with spacious and open layouts to accommodate residents who want a modern home without the burd...
$2,250
$2,250
Available: Right Now
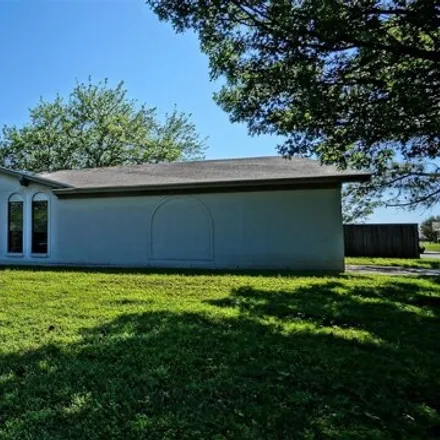
Gorgeous like-new 3 Beds 2 Baths charming home is available on May 1st. Just minutes access to Highway 35 and Chisholm Trail Pkwy Tollway. Schools, supermarket, retail and restaurants just nearby. Luxury vinyl flooring graces the whole area, the stun...
$2,700
$2,700
Available: Right Now
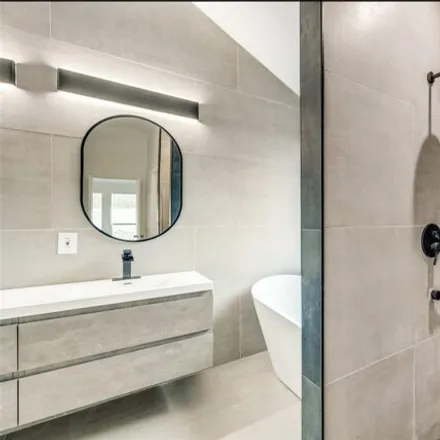
Move in ready beautifully renovated home in the heart of Burlenson. 4 bedrooms + office. Study could be used as 5th bedroom as there is a closet. Split bedroom floorplan. Granite kitchen counters and very close to Hidden Creek Golf course, shopping a...
$2,400
$2,400
Available: Right Now
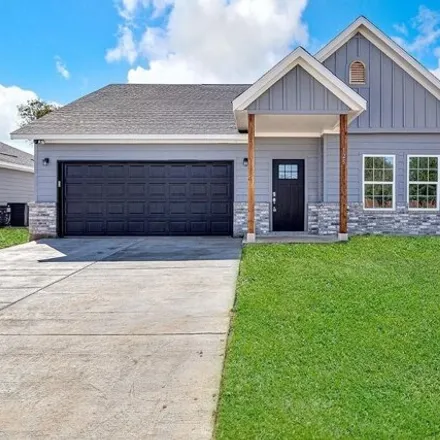
Welcome to your new oasis in Crowley, TX, just steps away from the vibrant downtown Crowley! This stunning new construction home boasts 3 bedrooms and 2 bathrooms. The spacious master bedroom features a large walk-in closet, while the kitchen offers ...
$2,295
$2,295
Available: Right Now
Great 3-2-2 in Burleson Meadows. House has an open floor plan with a brick WBFP in the living area. Kitchen is open to the breakfast area and includes a built-in microwave, dishwasher, disposal and stove. Primary bedroom features a walk-in closet and...
$4,000
$4,000
Available: Right Now
Move-in ready, Joshua ISD, Super spacious home featuring 6 bedrooms and 4 bathrooms, master room on first floor; granite countertops, living area featuring large windows and fireplace, large back yard with a covered patio, and a nice size pool to enj...
$1,795
$1,795
Available: Right Now
Open house this Saturday, March 16 from 12-2pm. Very clean and well kept 2 bed 2 full bath duplex located in a quiet Burleson neighborhood. This property has everything you want in a rental. Community pool, playground, and walking trail all wi...
$2,245
$2,245
Available: Right Now
Beautiful home offers 3 bedroom and 2 bathroom with carpet and tile, vinyl type flooring. Home has 2 attached car garage. This home offers a spacious kitchen, updated bathrooms and is located in a beautiful location. The living room is stunning and h...
$2,449
$2,449
Available: Right Now
Life. Well Lived. Take a look at this beautiful home featuring 4 bedrooms, 2 bathrooms, and approximately2, 116square feet. Enjoy the freedom of a virtually maintenance free lifestyle while residing in a great community. This home is professionally m...
$2,095
$2,095
Available: Right Now
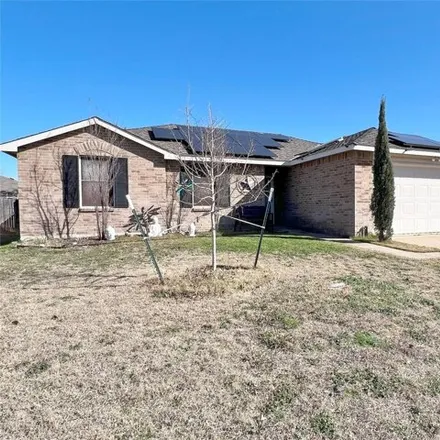
Corner lot with large backyard. Two large living areas. Family room has French doors overlooking patio area. Master bedroom has large cedar closet and private bath. Guest bath has jetted tub. Walk in closets in secondary bedrooms. Kitchen features an...
$2,250
$2,250
Available: Right Now
Welcome to your newly renovated home! This local-owner lease property is freshly painted with new appliances, new flooring, new hot water heater, and new AC unit. House has an open floor plan with 3 bedrooms, 2 bathrooms, and a spacious 2-car garage,...
$1,845
$1,845
Available: Right Now
Welcome to your future Reszi home on a corner lot home that is walking distance to the schools! Home features: 3 bedrooms, 2 baths, 2 living areas and a dining area! Nice fireplace with a ledge. Kitchen features: lots of cabinets, windows that open t...
$1,150
$1,150
Available: Right Now
$1,925
$1,925
Available: Right Now
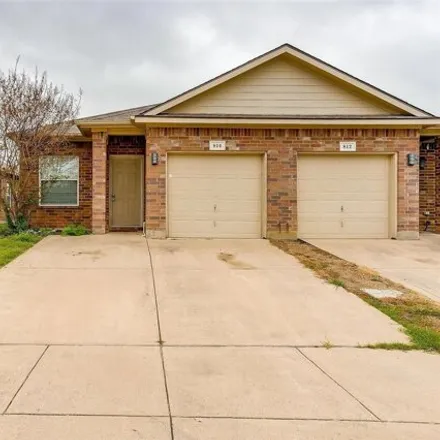
Spacious 3 bedroom 2 bath duplex just blocks from Mistletoe Hill Park. Newly updated with neutral color palette, and wood lamient flooring throughout. Kitchen comes equipped with all essential appliances. Enjoy easy access to local schools, shopping ...
$2,450
$2,450
Available: Right Now
We've tailored a unique collection of features into a thoughtfully designed home 3 and 4 bedroom homes located in Crowley, TX. Our floorplans are designed with spacious and open layouts to accommodate residents who want a modern home without the burd...
$2,595
$2,595
Available: Right Now
Adorable home ready for move in! This home offer 4 bedroom and 2 bathrooms located in beautiful place. In addition, this home features ceramic tile, wood and carpeted floors, a modern kitchen with updated cabinets and offer plenty of counterspace. Ho...
Burleson
Burleson, TX has a population of 41,962, including 83% white, 13% latino, and 3% black.
| Population | 43,296 |
| Median Age | 34 |
| Poverty Rate | 6% |
| Household Income | $74,341 |
| Number Of Employees | 21,095 |
| Median Property Value | $150,600 |
What is the Average Rent for Burleson, TX Apartments?
| Month | Median Price |
|---|---|
| Apr 2024 |
$2,045
|
| Mar 2024 |
$2,045
|
| Feb 2024 |
$2,045
|
| Jan 2024 |
$2,045
|
| Dec 2023 |
$1,929
|
| Nov 2023 |
$2,044
|
| Month | Median Price |
|---|---|
| Apr 2024 |
$2,125
|
| Mar 2024 |
$2,125
|
| Feb 2024 |
$2,125
|
| Jan 2024 |
$2,125
|
| Dec 2023 |
$2,009
|
| Nov 2023 |
$2,095
|
Be informed and make custom offers based on median rent prices. However, keep in mind that the price may vary depending on the size and amenities of the apartments for rent.
Renter's FAQ About Burleson, TX
-
How can I find apartments for rent in Burleson, TX?
There are several ways to find apartments for rent in Burleson, TX. You can start by searching online on real estate platforms or contacting local real estate agents who specialize in rentals. Another option is to drive around the neighborhoods you're interested in and look for "For Rent" signs. Additionally, you can ask friends, family, and colleagues if they know of any available rentals in the area.
-
What types of properties are available for rent in Burleson, TX?
In Burleson, TX, you can find a variety of properties available for rent, including houses, apartments, duplexes, and condos. Each type of property offers different features, sizes, and layouts, so you can choose the one that best fits your needs and preferences.
-
What amenities can I expect in apartments for rent in Burleson, TX?
Apartments for rent in Burleson, TX usually come with a range of amenities to enhance your living experience. Common amenities include dishwashers, air conditioning, parking spaces, fireplaces, and gardens. However, the availability of specific amenities may vary depending on the rental property, so it's always good to inquire about the amenities offered when contacting landlords or property managers.
-
Is public transportation easily accessible in Burleson, TX?
While Burleson, TX is primarily a car-dependent city, there are public transportation options available for residents. The T (Tarrant County Transportation) operates bus services that connect Burleson with neighboring cities such as Fort Worth. Additionally, rideshare services like Uber and Lyft are popular and provide convenient transportation alternatives for getting around the area.
City Overview
The median household income in Burleson, TX is around $72,670, while the median age is 33. This city is a home to major universities: n/a, n/a, and n/a. 19,776 employees work in Burleson, TX. The homeownership rate among the residents is 71.95%. The median property value that you should keep in mind is $143,900.