Cambria, CA, USA apartments for rent

$3,750
$3,750
Available: Right Now
Our single-level home is a cozy, yet spacious retreat on Happy Hill in Cambria. The former home of an artist provides the decor and landscaping that reflects the serenity that Cambria is known for. The peaceful & short 1/2 mile walk to the beach make...

$16,260
$16,260
Available: Right Now
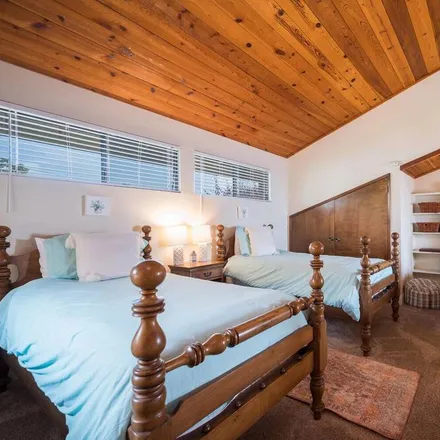
Located in Marine Terrace, this 3 Bedroom, 2 1/2Bathroom home comfortably sleeps 8 with 1 King and 3 Queen beds. There is a TV in the master bedroom as well as in the living room for family enjoyment. The kitchen is part of the open living space and ...

$6,870
$6,870
Available: Right Now
California dreaming at its finest! Posh Cambria A-frame blocks from Fiscalini Ranch nature preserve, 1 mile from CA's preeminent tide pools, 2 miles from downtown Cambria, and 5 miles from local wineries and visitor attractions. Tastefully appointed ...

$6,090
$6,090
Available: Right Now
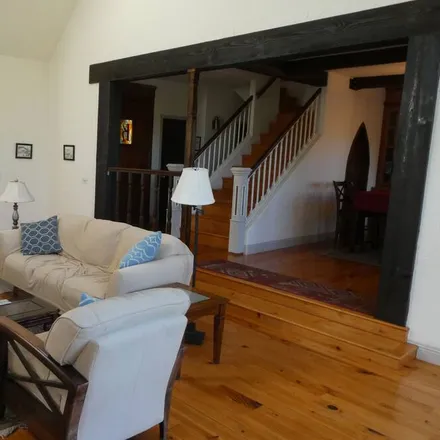
Cambria EscapeOur calendar is updated in real-time & our nightly rates are accurately displayed. Simply enter your desired dates and click 'Book Now!'Enjoy an amazing stay at a cozy cabin-esque home just a mile from the ocean. The exposed bea...

$7,740
$7,740
Available: Right Now
This charming two level home, with its light & airy atmosphere, offers a relaxed and cozy setting on top of sunny Park Hill. Moonstone Beach, Shamel Park & the Fiscalini Ranch Preserve are all within easy walking distance. The house itself offers a l...
$8,790
$8,790
Available: Right Now
Seaview on burton: This Tudor style home sits above a Monterey pine forest sweeping a half mile down to the ocean, one of the few vacation homes in the area which borders a forest preserve. The quaint seaside village of Cambria is a leisurely ...

$13,020
$13,020
Available: Right Now
Bright, open and great views! That's what you can expect at Ocean Mist. This home is 1 block from the ocean and only a few blocks from the East West Ranch which offers a bluff trail along with forest trails. Great for taking your fury friend on hikes...

$6,030
$6,030
Available: Right Now
Located on the lodge side with Fiscallini Trail entrance just a few steps away from the front door. Secluded from neighbors and a great place to unwind. Balconies overlook the trees and the sunset never gets old. The house is three-stories tall and i...

$16,470
$16,470
Available: Right Now
Oceanfront Cottage is a charming oceanfront vacation rental nestled above the Pacific Ocean in the quaint artsy village of Cambria. This home is likely to be the most unique and cozy cottage you'll ever vacation at! The house features large windows, ...

$13,590
$13,590
Available: Right Now
Come enjoy Cambria in this comfortable Pet friendly 2 bedroom, 2 bathroom home (no fenced in yard) in Marine Terrace. This popular home is conveniently located across the street from the Fiscalini East/West Ranch. If you like to walk along the...
$3,300
$3,300
Available: Right Now
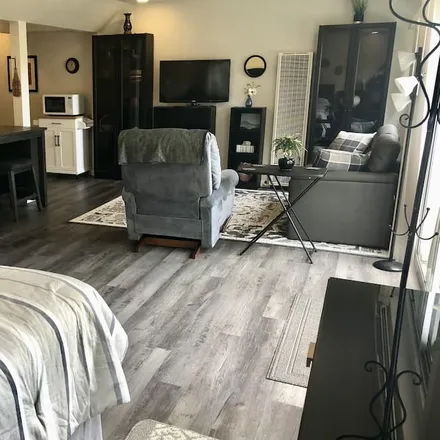
You will have full private use of this cute and comfortable downstairs 550 foot studio apt..with outdoor seating area with a beautiful view of Fiscallini ranch and creek trail. You can sit, relax and enjoy a cup of coffee or glass of wine while enjoy...
$8,310
$8,310
Available: Right Now
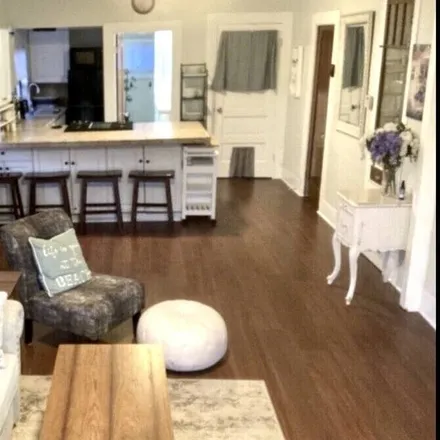
This gem is in the middle of the action. Walking distance from restaurants, shops, antiquing, wine tasting, nature walks and the beach. What a great place to maintain or get back that peaceful state of mind we are all searching for these days.Thi...
$9,810
$9,810
Available: Right Now
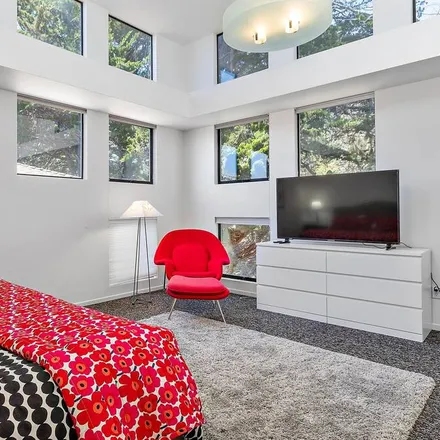
“Out of the Blue” Home and Studio is a Memphis Style contemporary Home on Cambria’s Moonstone Beach designed as a weekend get-away for the artist owner and her husband.It has an incredible location just steps from Moonstone Beach boardwalk. It is...

$9,120
$9,120
Available: Right Now
The Bonny Cottage By The SeaA Cozy Early Cambria CabinThe Bonny Cottage, one of Cambria’s original cabins, is poised high in a delightful area affectionately known as Happy Hill. Tranquil, private, surrounded by trees and gardens, it is less ...
$12,840
$12,840
Available: Right Now
Birds Eye View is high up on Park Hill with beautiful views through the pines to the ocean, Moonstone Beach and out to Piedras Blancas Lighthouse. 3 blocks walking distance to Moonstone Beach , Shamel Park , Fiscalini Ranch Preserve and a 20 minute w...

$80,730
$80,730
Available: Right Now
WELCOME! We are the new owners of the famous and loved Pickford House Vacation Rental! Although Pickford has been partnered with VRBO for over a decade, this is a new listing. Pickford is a perfect destination for your gathering. Sleeps up to 29. We’...

$12,810
$12,810
Available: Right Now
Coastal Vista in Cambria California is the perfect get away for couples or families including 2 separate living spaces, Game room with pool table & big screen t.v. The home has a tranquil luxurious feel throughout with high end furnishings in every r...

$11,610
$11,610
Available: Right Now
This 20 year-old home is in a beautiful residential neighborhood overlooking Marino Reserve. All living areas and bedrooms have complete ocean views. The large living area with a cozy fireplace is connected to the dining/kitchen area. The deck, with ...
$15,330
$15,330
Available: Right Now
From the moment you walk in the front door you will feel as if you are in Paradise. This extremely comfortable yet modern home features an open floor plan with hardwood floors throughout, granite countertops in the kitchen and the Master bathroom. Th...
$18,090
$18,090
Available: Right Now
Escape to our charming beach house with unparalleled ocean views. This cozy retreat features a fireplace in the living rooms, an open-concept design, a fully equipped kitchen, and three comfortable bedrooms. Spend your days unwinding on the expansive...

$36,300
$36,300
Available: Right Now
Please contact Mary directly to request length of stay.The Magical Pied Piper Ranch is one of the most breathtaking properties on the unspoiled Central California coast. An updated, spacious, 4,700square foot, English Cottage style villa, perched...

$11,640
$11,640
Available: Right Now
No Pets Allowed. Cambridge View is the kind of home that will convince you to return to Cambria year after year. Situated on Park Hill, it is aptly out of the windows North to Piedras Blancas lighthouse and Hearst Castle. Enjoy the breathtaking ocean...
Cambria
Cambria, CA has a population of 5,934, while the median age is 62. The household income in Cambria, CA is around $65,788. The homeownership rate among the residents is 73%. The median residential property value in Cambria, CA that you should keep in mind is $620,400.
| Population | 5,934 |
| Median Age | 61.5 |
| Poverty Rate | 9% |
| Household Income | $65,788 |
| Number Of Employees | 2,436 |
| Median Property Value | $620,400 |
Renter's FAQ About Cambria, CA
-
What types of properties are available for rent in Cambria, CA?
You can find a variety of properties for rent in Cambria, CA including houses, townhouses, and apartments. These options cater to different preferences and budgets, ensuring you can find the perfect place to call home.
-
What are some popular amenities available in rental properties in Cambria, CA?
Rental properties in Cambria, CA often come with desirable amenities such as fireplaces, dishwashers, parking spaces, balconies, and gardens. These amenities enhance comfort and convenience, allowing you to enjoy your living space to the fullest.
-
Is Cambria, CA a suitable place for young families?
Yes, Cambria, CA is a wonderful place for young families. With its peaceful coastal setting and close-knit community, Cambria offers a safe and family-friendly environment. There are excellent schools, parks, and recreational activities available, making it an ideal place for children to grow and thrive.
-
What activities can I enjoy in my free time in Cambria, CA?
Cambria, CA offers a plethora of activities to enjoy during your free time. You can explore the breathtaking beaches and scenic coastal trails, visit art galleries and boutiques in the charming village, indulge in delicious cuisine at local restaurants, or take part in outdoor activities like hiking, biking, and kayaking. There is something for everyone in Cambria.