Carpinteria, CA, USA apartments for rent

$15,000
$15,000
Available: Right Now
My home is located in the closest beach area of Carpinteria, on the corner of 3rd and Elm, 1 block up from the beach, and an equal distance to the main street of town (Linden). There are only a few beach houses with this kind of privacy available to ...

$11,040
$11,040
Available: Right Now
Fall asleep each evening to the sounds of the ocean! Unit 206 is the perfect second-floor unit with gorgeous views of the beautiful Carpinteria State beach.This comfy unit has a fully stocked kitchen with everything to create a delicious meal. Th...
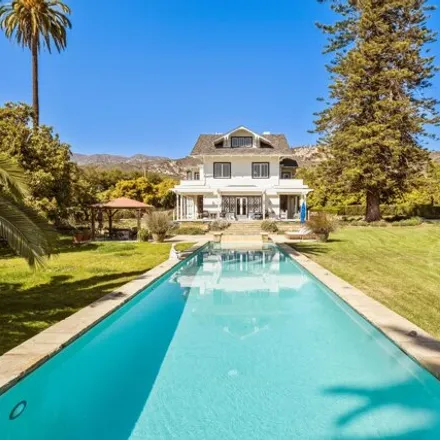
$13,500
$13,500
Available: Right Now
Available Now! Imagine an exquisite, secluded, historic country estate, providing intimate luxurious accommodations for discerning guests. Boasting 7 bedrooms and 5 bathrooms. The main house is large, over 9000 square feet, built in 1880, of solid re...

$5,700
$5,700
Available: Right Now
Located on a five-acre coastal farm in the quaint, picturesque ocean-side city of Carpinteria, The Avo-Cottage awaits your getaway. This tiny house cottage has everything from ocean and mountain views to a seven-hole putting green. Conveniently locat...

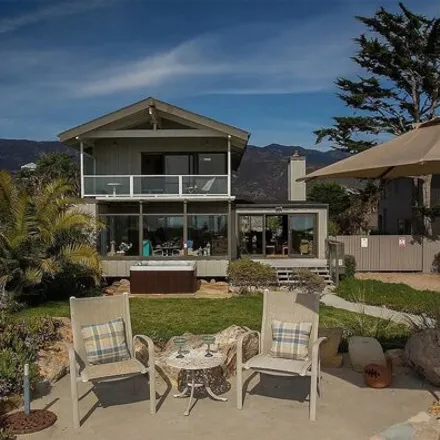
$42,000
$42,000
Available: Right Now
Padaro Sands is a beautiful beach home located on the sand on Padaro Lane. The 2 bedrooms 3 baths gated house offers great ocean, coastal, and mountain views. It has a wonderful deck for entertaining, grilling, and watching sunsets and dolphins passi...

$9,840
$9,840
Available: Right Now
Gather your loved ones and retreat to this elegant 2-bedroom, 1-bathroom vacation rental apartment in Carpinteria. The moment you arrive at this lovely home, you'll know you made the right choice for your revitalizing vacation. Situated just a 10-min...
$30,000
$30,000
Available: Right Now
Private Beach House - Located in a private secure cove on the once-rated world's safest beach, protected by the Channel Islands on the ocean side and an estuary on the mountain side, this is truly a cherished place. It is a fully furnished 4 bedroom ...

$14,700
$14,700
Available: Right Now
Step onto the sand from the large ocean-facing deck of this 3 bedroom, 2 bath family beachhouse. Located just 10 miles south of Santa Barbara, CA in the popular resort community of Carpinteria, this house sits on the 'World's Safest Beach' sheltered ...

$15,690
$15,690
Available: Right Now
Welcome to your perfect beach vacation at Carpinteria Shores! This fully remodeled, luxury, ground-floor, two-bedroom, one-bathroom vacation rental is the crown jewel of the complex! It is located right on the beachfront in beautiful Carpinteria, Cal...

$6,210
$6,210
Available: Right Now
A beautiful and newly remodeled 3 bedroom condo walking distance from the beach, bluff trails, and coffee shops, and restaurants. This condo is a stones throw from a newly designed children’s park, community pool, and has a private patio ready for a ...

$19,530
$19,530
Available: Right Now
The Sun of Carpinteria!Embark on a sun-kissed journey to your idyllic vacation rental in Carpinteria! Just a block and a half from the radiant beach, this charming two-bedroom, one-bathroom retreat invites you to bask in the warm embrace of the S...
$5,100
$5,100
Available: Right Now
Peaceful relaxing guesthouse surrounded by flowers and greenery. Close proximity to the beach, mountains and polo fields. Private setting w shaded seating areas. Modern amenities and private entrance make for an ideal peaceful escape. This unit is tu...

$14,520
$14,520
Available: Right Now
100 steps to the sand! Your stay at Paradise Retreat at Pacific Shores will have you soaking up the sun and enjoying the quaint town of Carpinteria. This location is across the street from the beach entrance and within walking distance to all the fun...

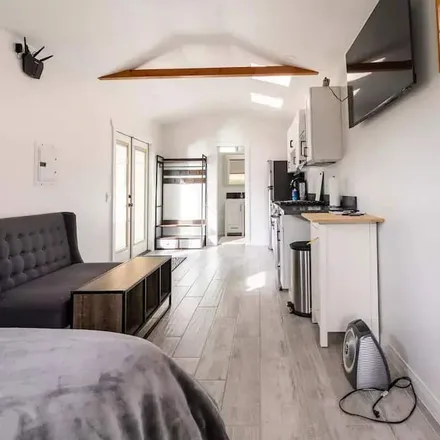
$3,450
$3,450
Available: Right Now
Sugar ShackOur calendar is updated in real-time & our nightly rates are accurately displayed. Simply enter your desired dates and click 'Book Now!'Get your fill of the bright California sunshine at this retro Carpinteria studio just a short w...

$8,000
$8,000
Available: Right Now
Step inside to an open living, dining, and kitchen area that's perfect for entertaining. The spacious layout allows for seamless interaction between rooms, making it ideal for hosting gatherings or enjoying a cozy night in. The kitchen is well-appoin...
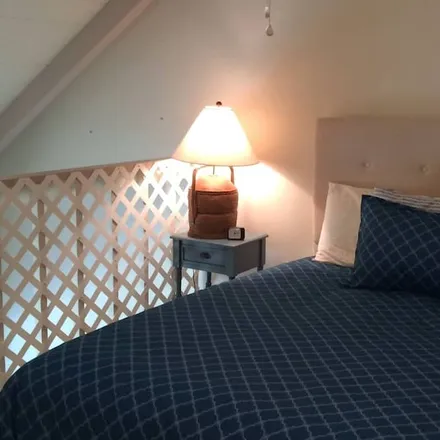
$2,610
$2,610
Available: Right Now
Cozy beach condo just a block to the sand at Carpinteria Beach, and across the street from the Salt Marsh Nature Park. Ideal for a couple's romantic getaway or a small family.The one bedroom, one bath townhouse sleeps 4 (see below), with a queen ...

$10,200
$10,200
Available: Right Now
This completely updated renovated beach condo on the first floor is conveniently located in the seaside town of Carpinteria, one of California's best kept secrets! This downstairs unit has 2 bedrooms and 1 bath, chefs kitchen with stainless steel app...

$29,850
$29,850
Available: Right Now
As soon as you enter, you feel the warm comfort and beauty of this private 4 bedroom home with spectacular ocean views. The Restoration Hardware designed living room and dining room, with fireplace, have plenty of seating to enjoy. Sun rise and sun s...

$12,750
$12,750
Available: Right Now
Beautifully remodeled 2 large bdrm 1 bath condo with fully equipped kitchen. this cozy condo comes with beautiful courtyards, barbecues, common deck with beautiful ocean view ! Located at sunset shores in carpinteria, ca . Privat...

$11,280
$11,280
Available: Right Now
Cozy Beachfront Condo in Carpinteria 2 bedrooms | 2 bathrooms | 4 GUESTSThis beachside condominium is just three steps away from "The World's Safest Beach" in Carpinteria. It’s the perfect spot for water sports, beach ent...

$8,370
$8,370
Available: Right Now
This beautiful condo has a unique open floor plan with top-of-the line Bosch appliances in the kitchen, including range, oven, and under-counter fridge. There’s a microwave, coffeemaker, even a wine chiller and stocked spice rack. In the living r...

$15,000
$15,000
Available: Right Now
Welcome to the Pelican Cottage! This stylish 3 Bedroom, 2 Bath house with Ocean & Mountain Views is the perfect blend of style, comfort, nature and a central location. Be in downtown Carpinteria or Summerland within minutes or just stay home & enjoy ...
Carpinteria
Carpinteria, CA has a population of 13,593, while the median age is 43. The household income in Carpinteria, CA is around $69,834. The homeownership rate among the residents is 53%. The median residential property value in Carpinteria, CA that you should keep in mind is $617,000.
| Population | 13,593 |
| Median Age | 43.4 |
| Poverty Rate | 8% |
| Household Income | $69,834 |
| Number Of Employees | 7,240 |
| Median Property Value | $617,000 |
What is the Average Rent for Carpinteria, CA Apartments?
The average rent for apartment in Carpinteria, CA: $6,078
(+2.6%)
| Month | Median Price |
|---|---|
| Jun 2024 |
$6,078
|
| May 2024 |
$5,923
|
| Apr 2024 |
$7,540
|
| Mar 2024 |
$7,540
|
| Feb 2024 |
$7,540
|
| Jan 2024 |
$7,540
|
Be informed and make custom offers based on median rent prices. However, keep in mind that the price may vary depending on the size and amenities of the apartments for rent.
Renter's FAQ About Carpinteria, CA
-
What types of properties are available for rent in Carpinteria?
In Carpinteria, you can find a variety of rental properties such as houses, condos, apartments, and townhouses.
-
What are some popular amenities that are commonly available in rental properties in Carpinteria?
Rental properties in Carpinteria often come with amenities like parking spaces, dishwashers, fireplaces, gardens, and balconies.
-
Are there any large employers in Carpinteria?
Carpinteria is home to several significant employers, including technology companies, agricultural businesses, and healthcare organizations. Some of the biggest employers in the area are known for their contributions to the semiconductor and pharmaceutical industries.
-
What information is useful for pet owners looking for rentals in Carpinteria?
If you are a pet owner looking for a rental in Carpinteria, it is essential to inquire about the landlord's pet policy. Some rental properties may have restrictions on pet sizes, breeds, or require additional pet deposits or monthly pet fees. It's always a good idea to discuss your pet's needs with the landlord before signing a lease agreement.