Fremont, CA, USA apartments for rent
$4,303
$4,303
Available: 01/02/2024
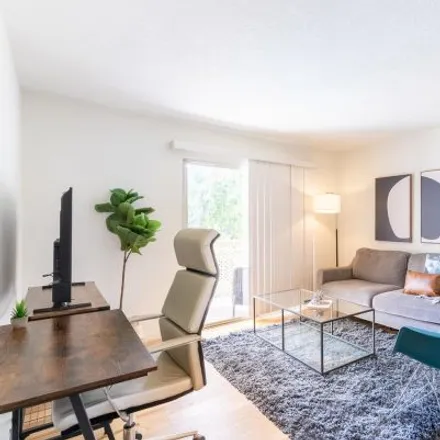
Apartment Show up and start living from day one in South Bay with this pretty one-bedroom apartment. You’ll love coming home to this thoughtfully furnished, beautifully designed, and fully-equipped Fremont home. (ID #SFO1508)Gorgeous...

$4,950
$4,950
Available: 01/08/2024
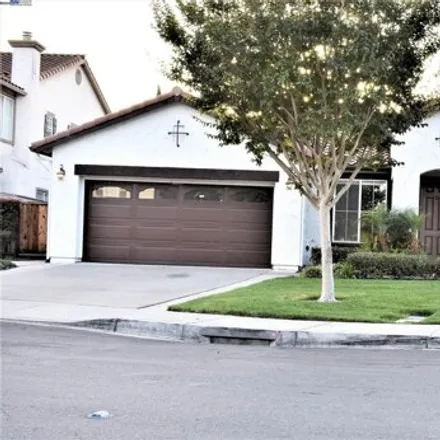
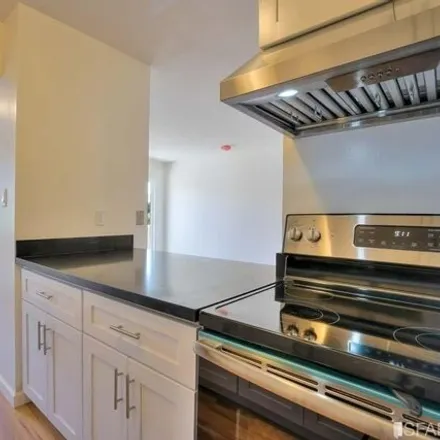
Open House7/27 1-4pm * Spacious & clean! Recent improvements include fresh interior paint, new laminate flooring and baseboards, quartz countertops and tile backsplash in the kitchen, painted cabinets and new hardware * Kitchen also offers re...

$3,990
$3,990
Available: Right Now
Why pay$10K - $12Kper month to own a property when you can rent a large size upgraded property for half the price? Do the math and see it for yourself and live a luxurious life for a very low cost! Move-In on08/01.Welcome to this stunning two-story l...
$4,233
$4,233
Available: 01/02/2024
Apartment Show up and start living from day one in South Bay with this pretty one-bedroom apartment. You’ll love coming home to this thoughtfully furnished, beautifully designed, and fully-equipped Fremont home. (ID #SFO1508)Gorgeous...

$12,840
$12,840
Available: Right Now
There is no hotel that feels like home. Stay in luxury in this beautiful, spacious, very clean, quiet and safe place, centrally located in San Francisco Bay Area/Silicon Valley, ideally suited for families, leisure and business travelers wanting a qu...

$28,650
$28,650
Available: Right Now
Upscale Newly Built! 600sqft. Beautiful In-law unit in the heart of Silicon Valley. One mile away from Faceb00k and minutes away high tech companies, right next to hwy 101 & public transportation. Guest house has its own wet bar, microwave, refrigera...
$1,600
$1,600
Available: Right Now
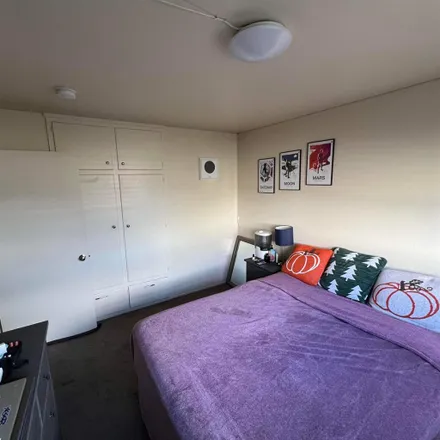
Please call Roger.. The home has four bed four bath.. Two bedrooms are occupied. Two other are available. Rent is based on the room to be taken. One room that is available has current Rent $1600/person/month Plus $100 for utilities that includes inte...

$1,350
$1,350
Available: Right Now
𝑇ℎ𝑒 𝐻𝑜𝑢𝑠𝑒 𝑖𝑠 𝑐𝑜𝑛𝑣𝑒𝑛𝑖𝑒𝑛𝑡𝑙𝑦 𝑙𝑜𝑐𝑎𝑡𝑒𝑑 𝑖𝑛 𝑁𝑜𝑟𝑡ℎ𝑔𝑎𝑡𝑒. 2 𝐵𝑢𝑠 𝑠𝑡𝑜𝑝𝑠 𝑤𝑖𝑡ℎ𝑖𝑛 5 𝑚𝑖𝑛𝑢𝑡𝑒𝑠 𝑜𝑓 𝑤𝑎𝑙𝑘𝑖𝑛𝑔 𝑑𝑖𝑠𝑡𝑎𝑛𝑐𝑒 𝑎𝑛𝑑 𝑈𝑛𝑖𝑜𝑛 𝐶𝑖𝑡𝑦 𝐵𝑎𝑟𝑡 𝑖𝑠 2 𝑚𝑖𝑙𝑒𝑠. 𝑁𝑒𝑎𝑟𝑏𝑦 𝑔𝑟𝑜𝑐𝑒𝑟𝑦 𝑠𝑡𝑜𝑟𝑒𝑠: 𝐷𝑢𝑙ℎ𝑎𝑛, 𝑅𝑎𝑛𝑐ℎ, 𝐿𝑢𝑐𝑘𝑦, 𝐼𝑛𝑑𝑖𝑎 𝐵𝑎𝑧𝑎𝑟. 𝐶𝑟𝑎𝑛𝑑𝑎𝑙𝑙 𝐶𝑟𝑒𝑒𝑘 𝑝𝑎𝑟𝑘 𝑖𝑠 𝑛𝑒𝑥𝑡 𝑡𝑜 𝑡ℎ𝑒 ℎ𝑜𝑢𝑠𝑒. 𝑌𝑜𝑢 𝑤𝑖𝑙𝑙 𝑠ℎ𝑎𝑟𝑒 𝑡ℎ𝑒 𝑏𝑎...
$7,626
$7,626
Available: Right Now
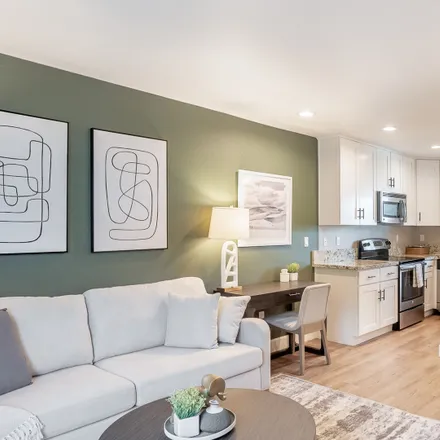
When you enter your Landing home for the first time, you'll notice the modern tones throughout, from the open concept floor-plan to the sleek kitchen with stainless steel appliances. Our included furniture and decor are expertly selected and placed f...

$5,200
$5,200
Available: Right Now
Welcome to 9657 Pontoon Way, a stunning modern home situated in the desirable Bridgeway community of Newark. This spacious residence boasts 5 bedrooms, 4.5 bathrooms, in a generous footage of 2573 square feet. Step inside to discover an open concept ...

$4,600
$4,600
Available: 01/08/2024
Beautiful 4 Bedroom / 2.5 Bath Home in Newark on Quiet Cul-de-SacExperience luxury living in this fully upgraded home featuring hardwood floors, recessed lighting, modern bathrooms, and a gourmet kitchen. Enjoy a spacious backyard complete with a...
$13,410
$13,410
Available: Right Now
I am from a culture where guests are considered as god’s avatar. Atithi Devo Bhava, also spelt Atithidevo Bhava (saint:), English translation: A guest is akin to God.I grew up seeing my family revere guests with the same respect as a god, treatin...

$4,500
$4,500
Available: Right Now
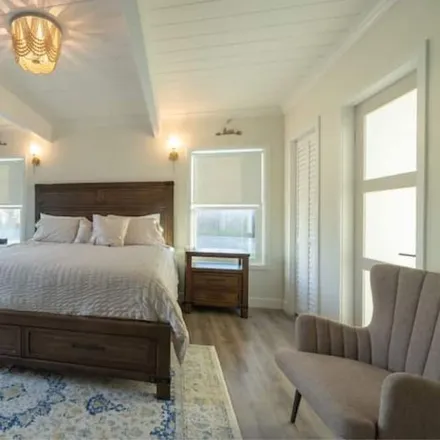
Charming Home for Rent in Milpitas. A beautifully maintained home ready for its next residents. This turn-key residence offers a spacious, open floor plan with high ceilings and abundant natural light throughout. Vaulted ceilings enhance the sense of...
$4,303
$4,303
Available: 01/02/2024
Apartment Show up and start living from day one in South Bay with this pretty one-bedroom apartment. You’ll love coming home to this thoughtfully furnished, beautifully designed, and fully-equipped Fremont home. (ID #SFO1508)Gorgeous...
$1,100
$1,100
Available: Right Now
3 minutes from highway 5 minutes from Newpark mall 5 minutes from Fremont hub5 minutes walking distance to to (sujus cafe, grocery outlet etc…)Internet included ( mg)Huge backyard Kitchen access Parking Water, housekee...
$2,600
$2,600
Available: Right Now
46728 Crawford #22 | Villa Caprice2BR/1BAwith Balcony Gorgeous complete remodel! New Hardwood Floors New Cabinets with Slow Catch drawers New Stainless Steel Appliances with Professional Exhaust Hood New Bathroom Walk-In Closet Balcony Top Floor Cove...

$4,500
$4,500
Available: 20/07/2024
Boasting 3 bedrooms, 2 bathrooms and 1 sunroom, this property is ideal for families or professionals seeking a spacious and inviting living space. Welcome to this stunning, newly remodeled single-family home that offers the perfect blend of comfort, ...

$6,200
$6,200
Available: Right Now
Gorgeous house in premium court location. 5 bedrooms 3 bathrooms house with 3-car garage. House features vaulted ceiling, bright and airy, newly updated kitchen, central Air Conditioning, hardwood flooring on 1st floor, wet bar in family room, spacio...

$4,200
$4,200
Available: Right Now
Very new and very well maintained town home constructed in 2020 available for rent. Beautiful 3 bed and 2 bath, 5 minutes to Bart and 10 minutes from tesla, 1 minute to elementary school. Available immediately. Fabulous facilities in the Community. G...

$3,880
$3,880
Available: 15/07/2024
Beautiful 3b/2b single family house in the desirable Parkmont area in central Fremont. Location:Walking distance to Top-Rated Parkmont Elementary, Centerville middle school and Washington high school.Walking distance to multiple ...

$27,240
$27,240
Available: Right Now
Welcom to Vista Montana located in LaQuinta California the gem of the desert. This resort home is adjacent to the Empire Polo Fields and site of both the Cochella music festival and Stagecoach music festival. Upon arrival you will enjoy a massive inv...

$6,930
$6,930
Available: Right Now
Cozy and Beautiful Entire 3bedrooms/1bathroom single family house space, centrally located to many amenities in a very quiet area. convenient access to many shopping centers and easy access to highwayThe house is spacious and newly decorated....
Fremont
Fremont, CA has a population of 230,964, while the median age is 38. The household income in Fremont, CA is around $122,191. The homeownership rate among the residents is 62%. The median residential property value in Fremont, CA that you should keep in mind is $785,700.
| Population | 230,964 |
| Median Age | 37.7 |
| Poverty Rate | 5% |
| Household Income | $122,191 |
| Number Of Employees | 116,110 |
| Median Property Value | $785,700 |
What is the Average Rent for Fremont, CA Apartments?
The average rent for apartment in Fremont, CA: $4,325
(-41.3%)
| Month | Median Price |
|---|---|
| Jun 2024 |
$4,691
|
| May 2024 |
$8,247
|
| Apr 2024 |
$6,579
|
| Mar 2024 |
$6,579
|
| Feb 2024 |
$6,579
|
| Jan 2024 |
$6,579
|
| Month | Median Price |
|---|---|
| Jun 2024 |
$4,325
|
| May 2024 |
$7,372
|
| Apr 2024 |
$5,988
|
| Mar 2024 |
$5,988
|
| Feb 2024 |
$5,988
|
| Jan 2024 |
$5,988
|
Be informed and make custom offers based on median rent prices. However, keep in mind that the price may vary depending on the size and amenities of the apartments for rent.
Renter's FAQ About Fremont, CA
-
What are the popular types of properties available for rent in Fremont, CA?
Fremont, CA offers a variety of rental options including houses, apartments, rooms, condos, and townhouses to suit different preferences and budgets.
-
What amenities can I expect to find in rentals in Fremont?
Rental properties in Fremont often come equipped with amenities such as dishwashers, parking spaces, air conditioning, balconies, and gardens to enhance your comfort and convenience.
-
Are there any additional fees associated with renting a place in Fremont?
Apart from the monthly rent, additional fees may include security deposits, pet deposits (if applicable), and application fees. It is important to clarify all fees involved before signing a rental agreement.
-
What schools and universities are located in Fremont, CA?
Fremont is home to several reputable educational institutions, including Fremont Unified School District, Ohlone College, and Northwestern Polytechnic University, offering options for students of all ages and interests.