Garland, TX, USA apartments for rent
$6,950
$6,950
Available: 06/03/2024
Our home caters to both short term and medium term stays, making it an excellent choice for corporate housing needs. Whether you find yourself temporarily displaced from your home or require accomodations for your team during an extended project in o...
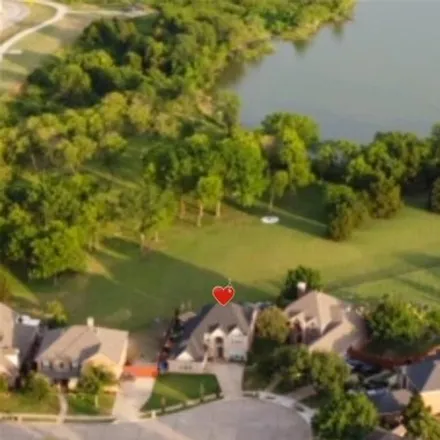
$5,350
$5,350
Available: Right Now
Escape to a breathtaking lakefront retreat boasting a romantic ambiance and luxurious amenities. Nestled on the tranquil shores of Lake Ray Hubbard, this enchanting residence offers a captivating blend of tranquility and sophistication. Immerse yours...

$2,565
$2,565
Available: Right Now
Awesome property very close to the Saphire Bay project. Rockwall Shopping and dining across the bridge to the east and Bass Pro across the bridge to the west. This Location is so perfect and the home is so comfy with its Mid-Century charm and parking...
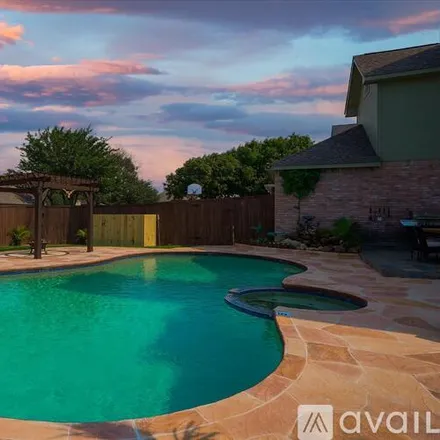
$15,930
$15,930
Available: Right Now
Summary:More than 3000 sqft are waiting for you! This is your dream house: 6 well decorated bedroomsPlenty space for the perfect family time :) Huge backyard with night lights. - Game room. - Smart TV's...
$1,600
$1,600
Available: Right Now
Walking Distance to Lake Ray Hubbard and the Marina. Private and Cozy Upstairs End Unit, Featuring an upstairs unit with 2 Bedrooms and 2 Baths, Highway 30 is also at your convenience. There are 2 Balconies and a Fireplace. Tile and vinyl Flooring th...

$2,100
$2,100
Available: Right Now
3 bedroom and 2 bathroom, One story, Very clean, sweet cozy home, bright and lots of lights inside and out, plenty of parking space in the driveway, along with two car garage with extra storage space, huge back yard patio. Every street with large tre...
$2,300
$2,300
Available: Right Now
Spacious 1748 Square foot, 3 bedroom 2 bath, Desirable One Story Home that is Close to Lake Ray Hubbard, Highways, Hospitals, Shopping, and walking distance to the School. New Vinyl Flooring and Bathroom Tile and paint throughout. Hurry before the Bi...

$2,299
$2,299
Available: Right Now
Beautiful 3 bed 2 bath home with big covered Patio. Completely re-modeled Kitchen and two Bathrooms. The property has two large living rooms, additional breakfast room, and 2 car garage. The drive-way on the side of the home leads to the garage, prov...

$4,000
$4,000
Available: Right Now
Experience the charm of lakeside living in this stunning 3-story home nestled in Sapphire Bay, a master-planned community on the picturesque shores of Lake Ray Hubbard in Rowlett, TX. This brand new home offers a lifestyle where you can spend your da...

$2,400
$2,400
Available: Right Now
Enjoy this ( All appliances included ) One-Story Ranch-Style home on a quiet oversized interior lot! The open concept home boasts a wonderfully updated Kitchen, Shaker Style Custom Cabinets, Granite Counter-Tops, Modern Backsplash, Stainless A...

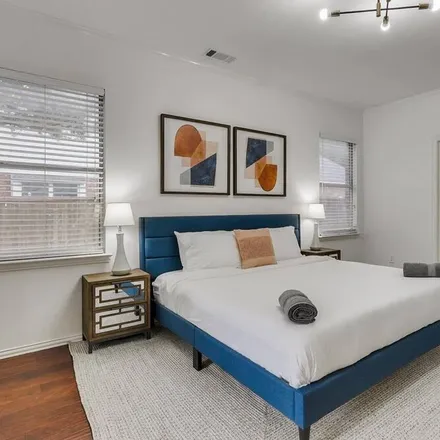
$3,500
$3,500
Available: Right Now
Fully furnished! Gorgeous property within the Williams Estates subdivision. This 4-bed 3-bath features high ceilings, granite countertops, built-in appliances, a built-in grill in the patio, and an oversized room in the second floor that you can use ...

$1,950
$1,950
Available: Right Now
Adorable 2 bedroom home in Casa View Heights. This home has been completely updated with new kitchen and stainless steel dishwasher, a completely renovated walk in shower new toilet and vanity. Gorgeous original hardwood floors and new tile throughou...
$4,900
$4,900
Available: Right Now
Spectacular fully furnished hotel style 5 bedrooms Pool home in the lovely quiet neighborhood of Dalrock Estates! From furniture, full kitchen supply and impressive TVs to Bluetooth speaker, smart thermostat, new Ss appliances an...

$1,363
$1,363
Available: 12/06/2024
Receive cash rebate up to $600 when you lease this apartment with us!! Contact Find1Rent1.com for Exclusive Online ONLY Special #2151 – We provide a 100% Free Service to find the best place for your budget. Considering a different property? Ca...

$3,295
$3,295
Available: 01/07/2024
Built in 2021 by Lennar. Like new condition. Single story home. Total of 4 bedrooms, 3 full bathrooms, living room, formal dining room, large backyard. Ample parking with 2 car garage, driveway, and street. Private neighborhood green belt with trails...

$2,250
$2,250
Available: Right Now
Welcome to 6326 McCartney Ln, Garland, TX 75043! This beautiful 3-bedroom, 2-bathroom home offers1, 986sqft of comfortable living space. The updated kitchen features granite countertops and a convenient island, perfect for entertaining. Enjoy the ext...

$2,850
$2,850
Available: Right Now
New Ashton Woods townhome offPGBT161.Stanford design ACME Full brick exterior and 8ft front and interior doors 10ft ceiling first floor . end unit lots ofWINDOWS.Upgraded floor from foyer into the open family-dining-kitchen area with Minimalis...

$2,700
$2,700
Available: Right Now
Welcome to this 4 bedroom, 2.5 bath beautifully updated home situated on a cul-de-sac, oversized lot. A light filled living room highlighted by easy to maintain hard surface floors and a cozy wood burning fireplace. Enjoy whipping up home-cooked meal...

$2,995
$2,995
Available: Right Now
Neatly maintained home featuring sparkling pool with board on board privacy fencing. Open floor plan with gas start cozy wood burning fireplace. Granite kitchen counter tops , subway tile, ceramic tile flooring, double sink, vaulted ceiling in family...

$1,850
$1,850
Available: Right Now
A well maintained home very close to Interstate I-30 for easy commute. Updated 3 Bedrooms, 2 Full baths, 2 car garage with granite counters in kitchen, easy to clean laminate flooring thru-out. Garland ISD choice of Schools. Showing Agents please rea...

$1,850
$1,850
Available: Right Now
Beautiful Renovated townhome. Light and bright living room with fireplace. Luxury vinyl wood planks throughout . no carpet. Attractive renovated kitchen open to the living area. Convenient bedroom and full bath is down. Master bedroom i...
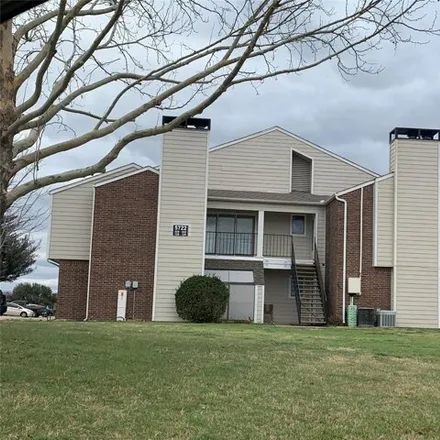
$1,700
$1,700
Available: Right Now
Ready for immediate move in ! Cute and cozy condo! Large Living w wood burning fireplace. Cute Kitchen ample storage; fridge included. Two Bedrooms with walk-in closets share central, full Bath. Laundry closet in hall has full size washer and ...
Garland
Garland, TX has a population of 235,965, while the median age is 35. The household income in Garland, TX is around $55,637. The homeownership rate among the residents is 62%. The median residential property value in Garland, TX that you should keep in mind is $132,600.
| Population | 235,965 |
| Median Age | 34.5 |
| Poverty Rate | 16% |
| Household Income | $55,637 |
| Number Of Employees | 114,112 |
| Median Property Value | $132,600 |
What is the Average Rent for Garland, TX Apartments?
The average rent for apartment in Garland, TX: $2,020
(-9%)
| Month | Median Price |
|---|---|
| Jun 2024 |
$1,219
|
| May 2024 |
$1,365
|
| Apr 2024 |
$1,384
|
| Mar 2024 |
$1,384
|
| Feb 2024 |
$1,384
|
| Jan 2024 |
$1,384
|
| Month | Median Price |
|---|---|
| Jun 2024 |
$2,020
|
| May 2024 |
$2,221
|
| Apr 2024 |
$2,157
|
| Mar 2024 |
$2,157
|
| Feb 2024 |
$2,157
|
| Jan 2024 |
$2,157
|
Be informed and make custom offers based on median rent prices. However, keep in mind that the price may vary depending on the size and amenities of the apartments for rent.
Renter's FAQ About Garland, TX
-
What types of properties are available for rent in Garland, TX?
You can find a variety of rental properties in Garland, including houses, apartments, condos, townhouses, rooms, duplexes, and lofts.
-
What are the most popular amenities in rental properties in Garland, TX?
The most popular amenities in rental properties in Garland include air conditioning, dishwasher, parking, fireplace, and garden.
-
What are some schools and universities in Garland, TX?
Garland, TX is home to several reputable schools and universities. Some notable ones include Garland Independent School District, Richland College - Garland Campus, and Amberton University. These educational institutions offer a wide range of programs and options for students of all ages.
-
Which are the largest employers in Garland, TX?
Garland, TX is host to several large employers providing a range of job opportunities. Some of the largest employers in the area include Garland Independent School District, City of Garland, Raytheon Intelligence & Space, Kraft Foods, and Aramark. These employers contribute to the city's vibrant economy and provide employment opportunities for residents.