Glendora, CA, USA apartments for rent
$2,550
$2,550
Available: 04/06/2024
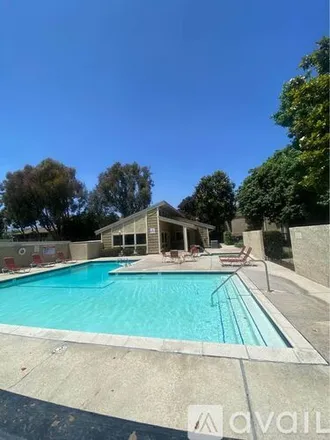
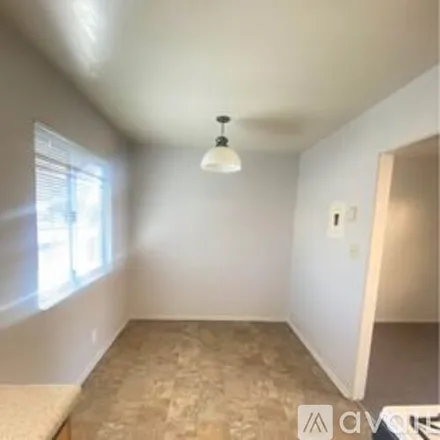
ADDRESS: 1130 e alosta avenue, azusa, ca, 91702 2 bedroom 2 bath 2 car garage Pool/jacuzzi Laundry on site STOVE & Dishwasher included BALCONY High ceilings ...

$3,350
$3,350
Available: Right Now
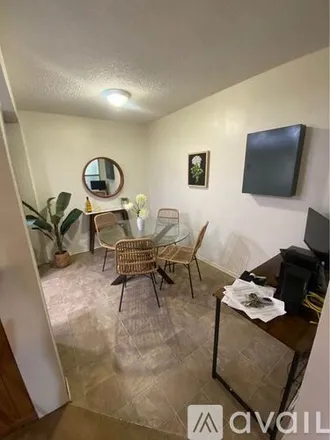
A rare lease opportunity in one of Glendora's most sought after communities, Glendora Greens. This tastefully remodeled, split level condominium boasts 2 bedrooms, 3 bathrooms and over1, 700square feet of living space. This unit features an additiona...

$5,495
$5,495
Available: Right Now
Stunning 4 bedroom, 2 bathroom home in the desirable Glendora, CA neighborhood. This house boasts a variety of amenities including a swimming pool, jacuzzi, built-in BBQ, attic, mini outdoor fridge, courtyard awning, and ceiling fans throughout. The ...

$3,800
$3,800
Available: Right Now
Welcome to your new home in Glendora, CA! This charming 1-story corner lot residence offers comfort and convenience in a serene neighborhood. Featuring 3 bedrooms and 2 bathrooms, this home is perfect for families or those seeking ample space.Step in...

$2,000
$2,000
Available: Right Now
Front unit of a Triplex with no shared walls. This 2 bedroom 1 bath unit comes with an extra bonus room. Laminate floors throughout. Fenced in front yard for your enjoyment. There are hook ups for a gas dryer in the kitchen. Sorry no garage, but room...

$3,360
$3,360
Available: Right Now
Enjoy a truly unforgettable space with brand new furniture and appliances. Bright, classy and charming, you won't want to leave this gorgeous studio. Small design custom kitchen with all necessities. Get an amazing rest with hotel bedding and rolled ...
$2,550
$2,550
Available: 04/06/2024
ADDRESS: 1130 e alosta avenue, azusa, ca, 91702 2 bedroom 2 bath 2 car garage Pool/jacuzzi Laundry on site STOVE & Dishwasher included BALCONY High ceilings ...

$3,450
$3,450
Available: Right Now
The pictures of this fantastic looking home are simply an easy way to review the overall beauty from the street view only. While walking up to the front door, you will be able to appreciate the front yard and its curb appeal. Upon entry, the dark flo...
$875
$875
Available: Right Now
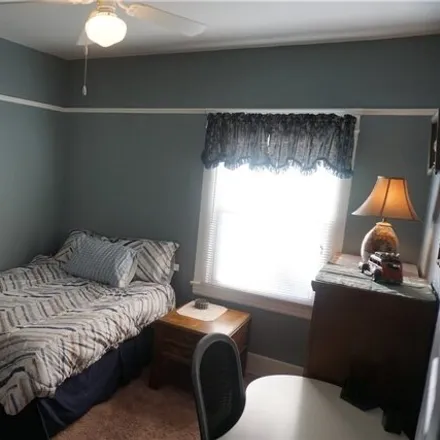
Furnished room for rent for student or commuter in a Three Bedroom, 1 bath Historic home. Must have good credit and pleaseNO PETS! Only one bedroom for lease by boarder perfect for one student or one commuter . (FOR ONLY (1) Person -...

$4,380
$4,380
Available: Right Now
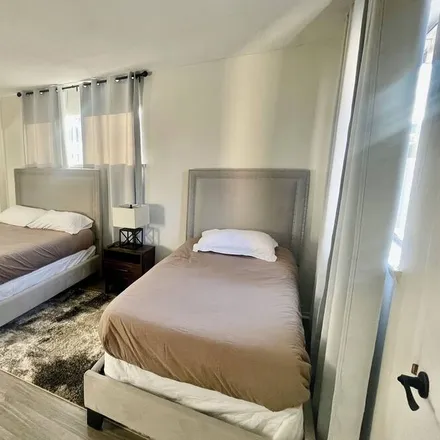
Welcome to our brand new private guest suite located in a safe and quiet neighborhood in prestigious northern Glendora! The stylish and serene space is thoughtfully designed to provide tranquility, privacy and comfort. With free 2 car driveway parkin...
$11,100
$11,100
Available: Right Now
Welcome to our cozy3-BD 2-BAretreat in Glendora, nestled near the San Gabriel Mountains. Inside you'll discover a tastefully decorated living space where every detail has been thoughtfully arranged .The open-concept layout allows for easy flow betwee...

$2,242
$2,242
Available: Right Now
Great value for this 1 Bedrooom 1 Bathroom apartment with private balcony, in-unit washer/dryer, hardwood floors throughout. Bright unit with floor to ceiling windows, stainless steal appliances, linen closet in the bathroom. Come see for yourself! V...

$11,970
$11,970
Available: Right Now
Beautiful home in quiet neighborhood with large kitchen and entertainment space located five minutes from town center and quaint restaurants and 25 minutes from downtown Los Angeles. Located within 30 minutes of theme parks like Disney Land, Knott’s ...
$1,750
$1,750
Available: 04/06/2024
Location:1160 E.Alosta Avenue, Azusa, Ca, 91702Comes with a stoveLaundry on the premises 1 assigned parking space Small pets allowed under 40 pounds with a$250.00deposit and$50.00monthly feeThe requirements are:Credit Scor...
$3,500
$3,500
Available: Right Now
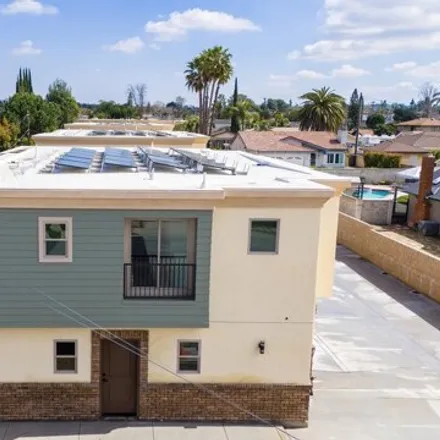
LEASE Beautiful townhome-style construction built in 2024. This home is one of 8 units, with every 2 units connected. Each unit features a walkway to the front door and a 2-car attached garage with direct entrance for convenience. The floorplan is op...
$7,200
$7,200
Available: Right Now
This charming costal style house just like ocean breeze will certainly relax your mind after a long day. This historic small cute house will offer you the central location of downtown Glendora, 3 mins walking for coffee and lots choices for restauran...
$3,495
$3,495
Available: Right Now
Your North Glendora pool home awaits! Enjoy views of the hills, whip up your next creation in the remodeled kitchen, and cozy up by either of the two fireplaces! The backyard has a covered patio - ideal for hosting or relaxing along with the pool and...

$9,750
$9,750
Available: Right Now
Beautiful Home in a peaceful middle class neighborhood. There are two homes on the same property that are completely separated. This home is the front home with a beautiful front yard and a peaceful garden in the back.You will feel at home. This ...

$3,300
$3,300
Available: Right Now
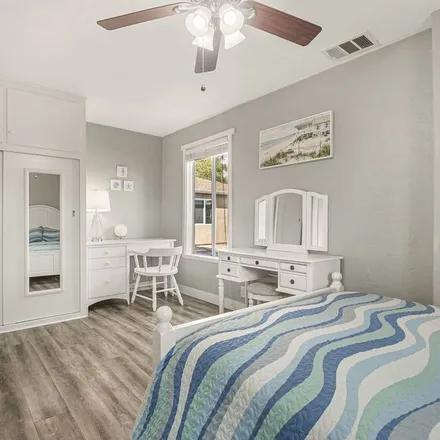
Very private gated community in Glendora. This hidden gem features 3 bedrooms and 3 full baths. 2 master suites upstairs and 1 bedroom downstairs. Both the master suites feature walk-in closets as well as a standard mirror closets. Nice size living r...

$4,300
$4,300
Available: Right Now
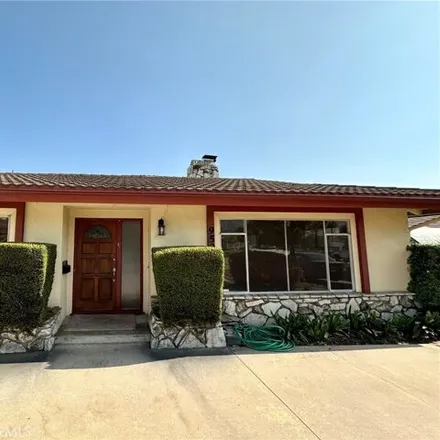
Nestled in the heart of North Glendora at1056 EComstock Avenue, this exquisite home epitomizes comfortable single-story living on a charming corner lot. Boasting three bedrooms and two bathrooms across a spacious1, 627square feet, every inch of this ...

$7,740
$7,740
Available: Right Now
Welcome to your temporary home with breathtaking views that will leave you in awe! This stunning accommodation offers a perfect blend of comfort and convenience, with easy access to major freeways, world-class shopping destinations, iconic sports sta...
$8,460
$8,460
Available: Right Now
Welcome to our Family Fun Hub where relaxation meets excitement. The newly renovated, modern 3BR home. Enjoy a refreshing swim in our pool, great for unwinding or cooling off after your games. Retreat to cozy bedrooms and create cherished moments in ...
Glendora
Glendora, CA has a population of 51,891, while the median age is 41. The household income in Glendora, CA is around $86,442. The homeownership rate among the residents is 71%. The median residential property value in Glendora, CA that you should keep in mind is $517,100.
| Population | 51,891 |
| Median Age | 41.4 |
| Poverty Rate | 9% |
| Household Income | $86,442 |
| Number Of Employees | 24,394 |
| Median Property Value | $517,100 |
What is the Average Rent for Glendora, CA Apartments?
The average rent for apartment in Glendora, CA: $2,949
(-5.1%)
| Month | Median Price |
|---|---|
| Jun 2024 |
$3,669
|
| May 2024 |
$3,929
|
| Apr 2024 |
$4,188
|
| Mar 2024 |
$4,188
|
| Feb 2024 |
$4,188
|
| Jan 2024 |
$4,188
|
| Month | Median Price |
|---|---|
| Jun 2024 |
$2,949
|
| May 2024 |
$3,109
|
| Apr 2024 |
$3,362
|
| Mar 2024 |
$3,362
|
| Feb 2024 |
$3,362
|
| Jan 2024 |
$3,362
|
Be informed and make custom offers based on median rent prices. However, keep in mind that the price may vary depending on the size and amenities of the apartments for rent.
Renter's FAQ About Glendora, CA
-
What are the most popular types of properties available for rent in Glendora?
The most popular types of properties available for rent in Glendora include houses, apartments, condos, and lofts.
-
What are some common amenities available in rental properties in Glendora?
Rental properties in Glendora often come with a range of amenities to cater to different lifestyles. Some common amenities include air conditioning, parking facilities, a garden or outdoor space, a dishwasher, and a pool.
-
What are the most important factors to consider when renting in Glendora?
When renting in Glendora, it's important to consider factors such as location, proximity to amenities, transportation options, safety, school districts (if applicable), and the overall condition of the property. Additionally, it is crucial to review the rental agreement carefully and understand the terms and conditions before committing to a rental property.