Hull, MA, USA apartments for rent
$8,500
$8,500
Available: 01/05/2024
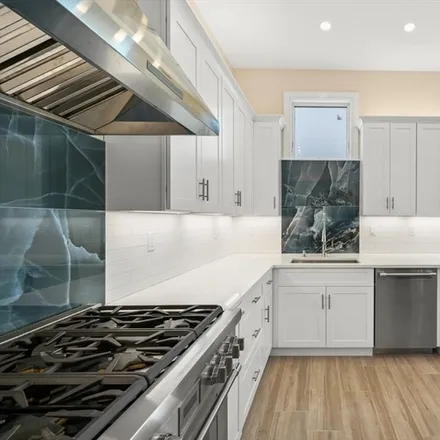
Indulge in the unparalleled beauty of uninterrupted ocean views and luxurious elegance within this magnificent 4 bedroom, 5 bathroom residence nestled in Quincy’s Rock Island Head. This exceptional four-level, single-family abode boasts exquisite cra...
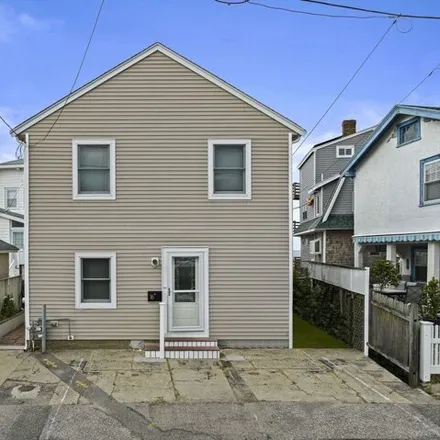
$8,250
$8,250
Available: Right Now
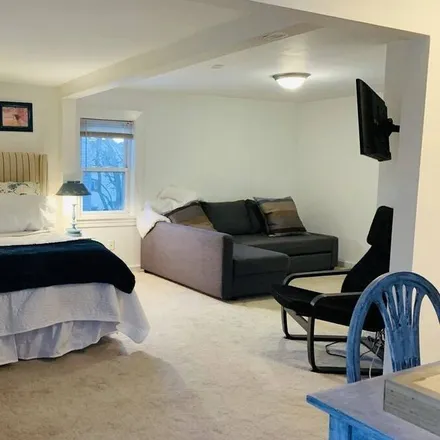
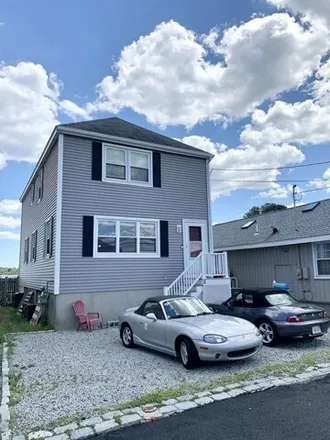
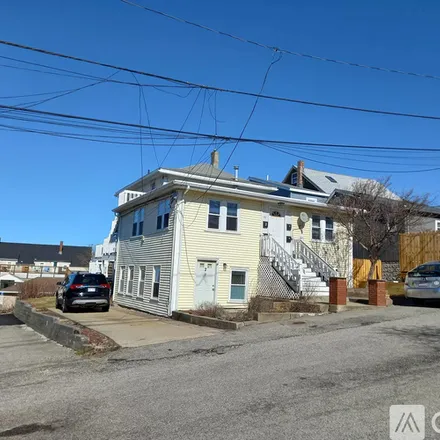
Private unique style home with open concept living room with fully function kitchen on first floor and large bedroom on second floor. 1.5 bathrooms; private and cozy backyard with grill and outdoor shower. Walking distance to the beach and the bay. S...

$18,000
$18,000
Available: Right Now
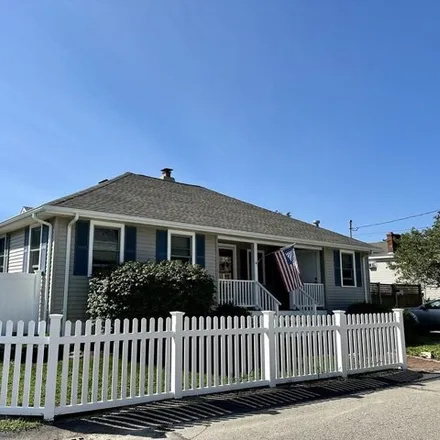
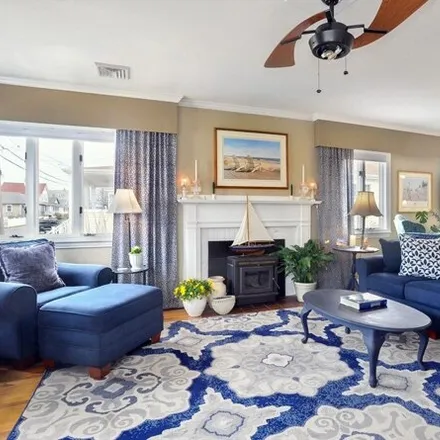
Location, Location 5 houses to the beach. What a fabulous way to spend your summer! Just relaxing in this coastal retreat enjoying the coastal community. Taking a stroll to the pier, kayaking, or an early morning walk along the waters edge, Bikers ve...

$18,000
$18,000
Available: Right Now
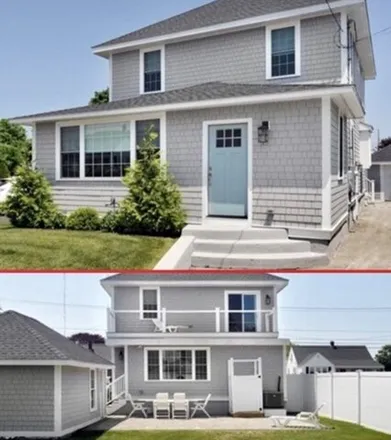
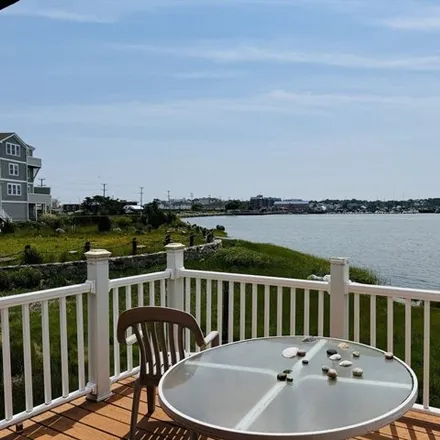
Enjoy quiet, seaside peninsula living in this waterfront home w/ ocean views from every bedroom. Endless possibilities to explore. Curl up in the sunporch watching the sunrise w/ your favorite book. Or have your coffee on the seawall. Biking/walks/ru...
$2,800
$2,800
Available: Right Now
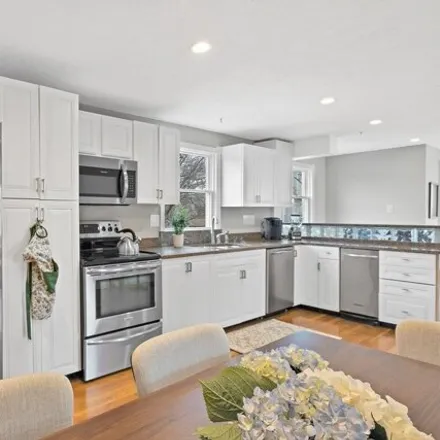
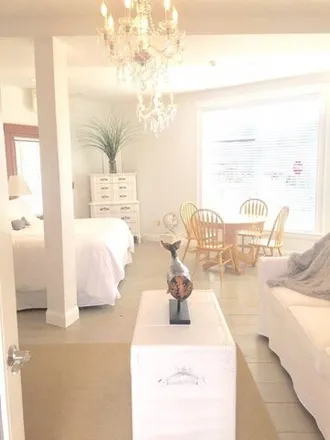
This is a Beautiful Furnished9/15-6/15Rental. Just steps to one of the sandiest sections of Nantasket Beach! Featuring a gorgeous granite kitchen with stainless appliances, glass backsplash, breakfast bar, dining area, pantry closet and french...
$28,000
$28,000
Available: Right Now
Get ready to soak up the sun and sand all August long at this fantastic 4-bedroom home just a short stroll to the beach. Indulge in the tranquility of coastal living while being in close proximity to a myriad of dining options, a delightful bakery an...

$3,400
$3,400
Available: Right Now
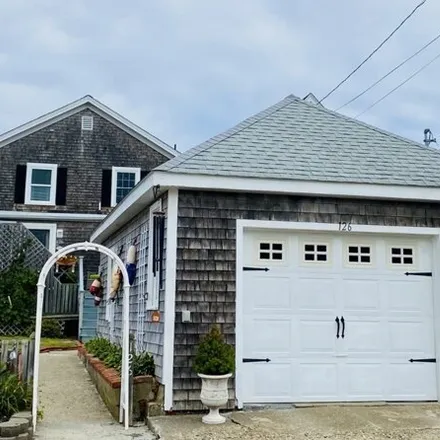
Rental with annual lease, Fantastic location 600ft from Black Rock Beach, Ocean views, garage parking, updated kitchen and bath, hardwood floors, private deck and large yard. Move in July 1. Good credit, proof of assets or income, NO PETS.Heat, hot/c...
$1,895
$1,895
Available: Right Now
Charming Winter rental sept 1st through MAY 31st Oceanfront 1 Bed/1 Bath Home with Wraparound Porch on Bay Street, Hull's Hampton Hill Experience coastal living at its finest in this charming one-bedroom, one-bath oceanfront home located in th...

$16,000
$16,000
Available: Right Now
JULY and August rental. Walk into this home offering timeless bayside living one of Hull's most coveted areas. Watch incredible sunsets and boat activity.. Oversized windows will captivate; showcasing the City skyline and views all the way to ...

$4,500
$4,500
Available: Right Now
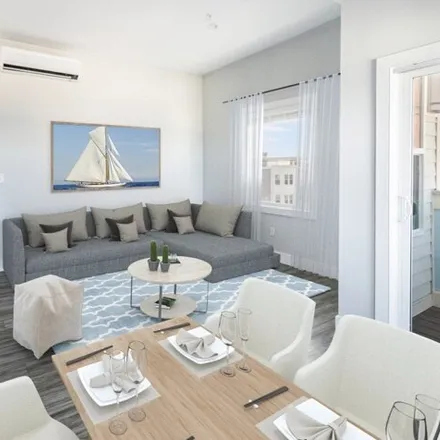
September5, 2024to June 5, 2025Seasonal Rental. Beautiful Ocean, Bay, Boston Skyline, and Marina Views from this Stunning Contemporary Home to rent with water, sewer, cable and internet included. 3 levels of living, gorgeous open floor plan, fabulous...
$2,800
$2,800
Available: Right Now
9/1-5/31 furnished off season rental. Live life on the Bay while enjoying this beautiful 2 Bedroom 1.5 Bath Home right down the street from Nantasket Beach and restaurants. It features a spacious Corian eat-in kitchen with an island and slider...
$18,000
$18,000
Available: Right Now
Escape to this charming 5-bedroom, 2 full, 2 half-bath home, ideally situated just two blocks from the pristine shores of Nantasket Beach in Hull w/ peaks of the ocean! This summer rental is exquisitely furnished, offering a seamless blend of coastal...

$4,900
$4,900
Available: Right Now
Newly renovated single family still under construction 4 bedroom, 3 full bathroom on a private road. In unit Laundry, new windows, custom kitchen with natural stone counters and stainless appliances, heated master bath floor, wide plank French oak fl...
$2,400
$2,400
Available: Right Now
Panoramic style ocean and bay views from this beautiful 1 bedroom 1 bath apartment with balcony at Ocean Bay. Open layout with high ceilings. One will love the quartz and stainless kitchen including microwave, fridge, stove, dishwasher and disposal. ...
$10,000
$10,000
Available: Right Now
New To Market! Oceanside Alphabet Street! Spend a relaxing August in this inviting, updated bungalow only 6 houses to beautiful, sandy Nantasket Beach! Fully furnished with utilities included. Light and bright, updated with eat in kitchen and parking...
$1,725
$1,725
Available: 01/07/2024
Amazing 1 bedroom, 1 bathroom apartment in Hull, with an extra room for an office. 300ft from the ocean. The apartment includes a deck overlooking the ocean and has access to a yard. Street parking is available for free in the area.Access...
$2,000
$2,000
Available: Right Now
Winter rental only 12/1/23 - 5/31/24.. best rental at nantasket beach !!! Traveling Nurse, Moving, Renovating, Splitting Up??...This is a perfectly appointed Fully Furnished, newly renovated beach heaven. 600 sq. ft. of pristine accommodations...
$4,900
$4,900
Available: Right Now
Wake up to an obstructed view of the sunrise and fall asleep to the rythm of the surf! Ocean views from the walls of windows in the expansive great room and the second floor, main bedroom that mirrors its size. So much livability here: kitchen with s...
$4,000
$4,000
Available: Right Now
This is a monthly short-term rental. Escape to the ultimate beach getaway just moments away from Nantasket Beach! This stunning 3-bed, 2-bath home offers a perfect one-month summer retreat. Step inside to a warm, inviting beach cottage ambiance. The ...
$10,500
$10,500
Available: Right Now
Newly renovated classic New England beachfront house - architect-designed interiors and high-end materials. 2 decks. Direct beach access from the house. Folding glass doors open the living/dining area up to the deck and beach. Child-friendly with wat...

$2,500
$2,500
Available: Right Now
Beautiful Water View from this one bedroom one bath unit. All utilities included this year round rental is great. Enjoy the large patio, spacious living room dining room, nice working kitchen, good size bedroom, tiled bath, stackable washer/dryer and...
$6,000
$6,000
Available: Right Now
This stunning Beach front property is Fully furnished and Completely updated offering unparalleled Ocean views from every room. This immaculately maintained home includes chef's kitchen with new appliances, custom deck, st...
Hull
Hull, MA has a population of 10,402, while the median age is 53. The household income in Hull, MA is around $80,584. The homeownership rate among the residents is 68%. The median residential property value in Hull, MA that you should keep in mind is $377,000.
| Population | 10,402 |
| Median Age | 52.8 |
| Poverty Rate | 5% |
| Household Income | $80,584 |
| Number Of Employees | 6,028 |
| Median Property Value | $377,000 |
Renter's FAQ About Hull, MA
-
What types of properties are available for rent in Hull, MA?
You can find a variety of rental options in Hull, MA including houses, apartments, condos, and townhouses.
-
What are the most popular amenities available in rental properties in Hull, MA?
The most popular amenities in rental properties in Hull, MA include parking spaces, air conditioning, dishwashers, gardens, and fireplaces.
-
Are there any additional fees associated with renting a place in Hull, MA?
It is common for landlords in Hull, MA to require tenants to pay a security deposit before moving in. This deposit is often refundable at the end of the tenancy, provided the tenant follows the terms of the lease. Additionally, tenants may be responsible for paying utilities and other fees outlined in the rental agreement.
-
Is there any information useful for students looking for rentals in Hull, MA?
Hull, MA is located near several universities and colleges, making it a popular choice for students. It is important for students to start their rental search early, as rentals near campuses tend to fill up quickly. Students may also want to consider shared housing options or look for rentals that offer roommate matching services to help reduce costs.