Lancaster, TX, USA apartments for rent
$2,450
$2,450
Available: Right Now
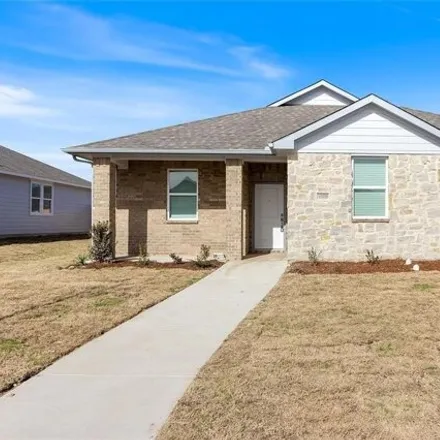
Step into the epitome of modern living! Nestled in Lancaster, Texas, our 4-bedroom, 2-bathroom homes blend style with comfort seamlessly. Discover the elegance of granite countertops, stylish LVP flooring, and stainless steel appliances. With luxurio...

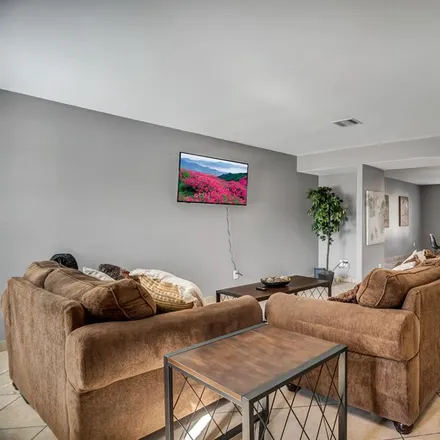
$2,800
$2,800
Available: Right Now
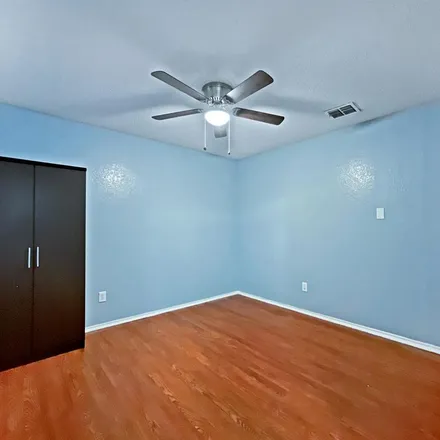
Open design single story home. All entertaining in open big area. All hard surface flooring, wood laminate in all common areas, luxury planking in the bedrooms. Elegant kitchen with dark cabinets, a big island - breakfast bar that opens to dining and...

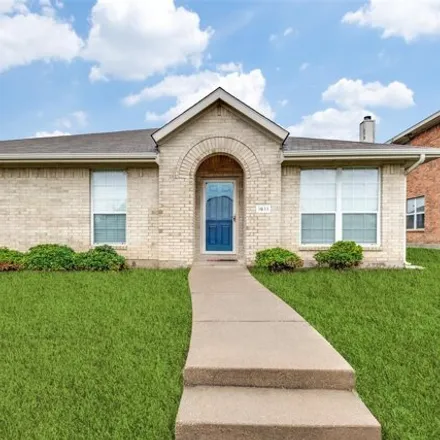
$2,500
$2,500
Available: Right Now
Discover your dream home with this charming 3-bedroom, 2-bathroom residence available for lease. Boasting an open floor plan, the space is adorned with elegant laminate wood floors that enhance its warm and inviting atmosphere. Perfect for modern liv...

$2,000
$2,000
Available: Right Now
Looking for your dream home? Through our seamless leasing process, this beautifully designed home is move-in ready. Our spacious layout is perfect for comfortable living that you can enjoy with your pets too; were proud to be pet friendly. Our homes ...

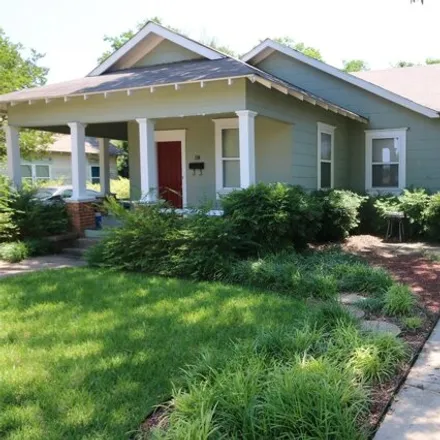
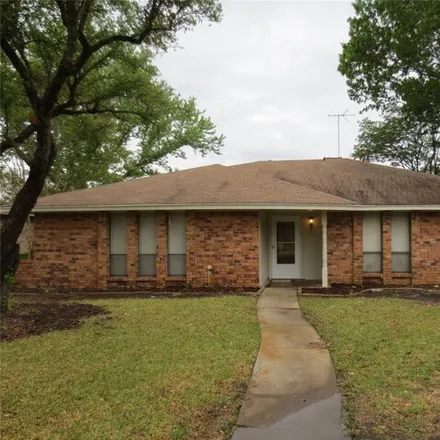
$6,300
$6,300
Available: Right Now
Family friendly neighborhood, house and yard. Home is located in the Historic District of Lancaster, Texas. 18 minutes from downtown Dallas, Arlington, and Waxahachie. Plus, 45-55minutes from Fort Worth, and Waco, Texas.The neighborhood is very s...
$499
$499
Available: Right Now
Elevate your lifestyle with HomeRoom – Lancaster's ultimate co-living experience!Make yourself at home in this beautifully remodeled, spacious, and well-lit home. You'll find all the essentials you need, along with wonderful housemates. Your sear...

$2,500
$2,500
Available: Right Now
This brand-new property boasts a modern design with no carpeting, making maintenance a breeze. Step inside to discover an inviting open floor plan, perfect for both everyday living and entertaining guests. This home features three spacious bedrooms, ...
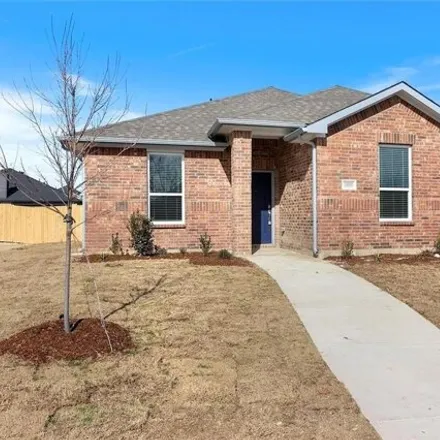
$2,250
$2,250
Available: Right Now
Nicely updated 4 bedroom 2 bath, with split master and walk in closets on corner lot. Master bath has tub and shower. Stainless steel appliances, kitchen island. New carpet and fresh paint. Separate dining area plus eat in kitchen, oversized utility ...
$2,500
$2,500
Available: Right Now
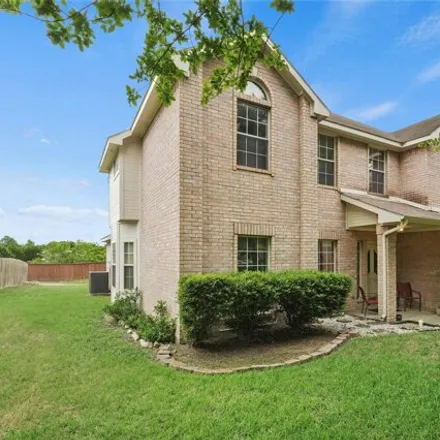
Welcome to this elegant 4 bed, 3 bath, 2-story home with two spacious living areas and a study. The main floor boasts a versatile study, a gourmet kitchen with modern appliances, and a welcoming living space. Upstairs, find four generously sized bedr...
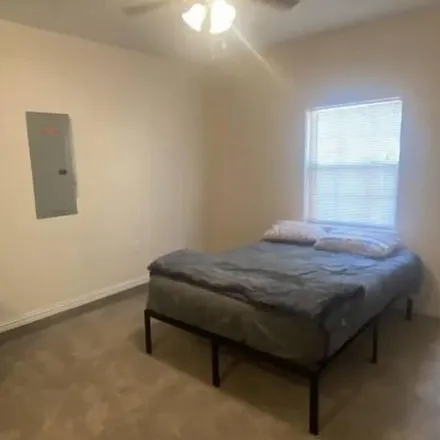
$1,295
$1,295
Available: Right Now
A perfect bungalow for that perfect individual . all appliances included ! Yard care included ! If youre looking to live a very well cared for unit with all original floors and plenty of space to roam, look no further! This unit offers ...
$2,400
$2,400
Available: Right Now
House for lease - Updated 4 bedroom-2 bath brick traditional in Wellington Park. Single story. Two living areas. Two dining areas. Open floor plan. Wood-burning fireplace, with gas starter, in den. Great kitchen with stainless steel appliances...
$2,450
$2,450
Available: Right Now
Step into the epitome of modern living! Nestled in Lancaster, Texas, our 4-bedroom, 2-bathroom homes blend style with comfort seamlessly. Discover the elegance of granite countertops, stylish LVP flooring, and stainless steel appliances. With luxurio...
$9,500
$9,500
Available: 20/12/2023
Fully Furnished Home!Recently rebuilt with the latest and greatest of modern styles and comforts, this luxurious vacation home is a dream! As soon as you step inside, you'll be struck by the stunning and modern design of the space. The sleek and ...

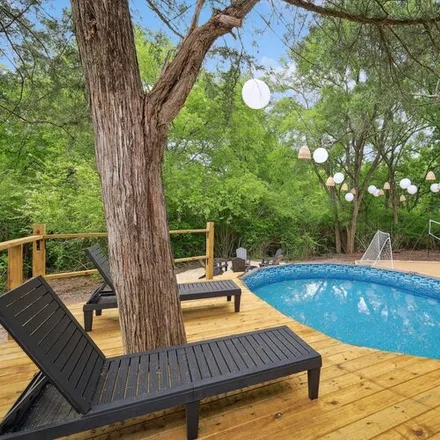
$2,800
$2,800
Available: 08/12/2024
Custom 3 bedroom, 2 bath home with 2 car garage. Spacious living room with hardwood floors, small pool in backyard that is fenced in, backyard with artificial turf and flagstone patio. Updated kitchen, smart appliances, updated bathrooms, luxury doub...

$2,150
$2,150
Available: Right Now
Enjoy this gorgeous home featuring living and entertainment space. This adorable home offers 3 bedroom and 3 bathroom home with carpet and laminate type flooring. Home has 2 attached car garage space. The modern kitchen is equipped with modern applia...
$1,995
$1,995
Available: Right Now
Nice single story home with lots of updates, large open living area with a fireplace and lvp flooring, dining area, large bedrooms, lots of closets, two car rear garage, extra room in gareage...fenced yard. great home.. must have two years of good...

$1,895
$1,895
Available: Right Now
Available now ! Beautiful 2 story duplex for rent in Lancaster. Almost 1400 Sq Ft. Features 3 bedrooms, 2.5 bathrooms, carport and large backyard. Recently renovated. New master bath tub and surround. Large kitchen fully equipped with Range, D...
$1,770
$1,770
Available: Right Now
Forget your worries in this spacious and serene space. This once garage turned room is exactly what you need for a long term stay. It’s spacious, with a working space, smart tv, mini fridge and so much more amenities.The neighborhood is diverse a...
$359
$359
Available: Right Now
Unlock elevated living at HomeRoom – Lancaster's top shared-living community!Discover a spacious shared living space tailored to meet all your needs. Personalize your unfurnished private bedroom with ample storage. The fully furnished common area...

$1,895
$1,895
Available: Right Now
Updated 3-2-2 situated on corner lot in Lancaster ready for move-in! Fresh paint and flooring throughout along with updated kitchen and bathroom cabinets and countertops. WBFP in the family room. Kitchen comes equipped with a built-in microwave and s...
$2,450
$2,450
Available: Right Now
Step into the epitome of modern living! Nestled in Lancaster, Texas, our 4-bedroom, 2-bathroom homes blend style with comfort seamlessly. Discover the elegance of granite countertops, stylish LVP flooring, and stainless steel appliances. With luxurio...

$315
$315
Available: Right Now
Elevate your living experience with HomeRoom – Lancaster's leading shared-living community!Meticulously updated spacious shared house designed for your comfort. Your unfurnished private bedroom, a blank canvas for personalization and storage, com...
Lancaster
Lancaster, TX has a population of 38,871, while the median age is 32. The household income in Lancaster, TX is around $51,628. The homeownership rate among the residents is 60%. The median residential property value in Lancaster, TX that you should keep in mind is $109,800.
| Population | 38,871 |
| Median Age | 32.1 |
| Poverty Rate | 17% |
| Household Income | $51,628 |
| Number Of Employees | 18,375 |
| Median Property Value | $109,800 |
What is the Average Rent for Lancaster, TX Apartments?
The average rent for apartment in Lancaster, TX: $2,207
(-18.4%)
| Month | Median Price |
|---|---|
| Jun 2024 |
$1,220
|
| May 2024 |
$1,475
|
| Apr 2024 |
$1,543
|
| Mar 2024 |
$1,543
|
| Feb 2024 |
$1,543
|
| Jan 2024 |
$1,543
|
| Month | Median Price |
|---|---|
| Jun 2024 |
$2,207
|
| May 2024 |
$2,705
|
| Apr 2024 |
$2,452
|
| Mar 2024 |
$2,452
|
| Feb 2024 |
$2,452
|
| Jan 2024 |
$2,452
|
Be informed and make custom offers based on median rent prices. However, keep in mind that the price may vary depending on the size and amenities of the apartments for rent.
Renter's FAQ About Lancaster, TX
-
What types of properties are available for rent in Lancaster, TX?
You can find a variety of rental options in Lancaster, TX including apartments, houses, rooms, and duplexes.
-
What are the popular amenities available in rental properties in Lancaster, TX?
Rental properties in Lancaster, TX often include amenities such as air conditioning, dishwasher, parking facilities, fireplaces, and gardens.
-
What is the walkability score in Lancaster, TX?
The walkability score in Lancaster, TX varies depending on the neighborhood. It is advisable to research specific areas to determine their walkability suitability for your needs.
-
What should I be aware of when renting an apartment in Lancaster, TX?
When renting an apartment in Lancaster, TX, it's important to carefully review your lease agreement, understand the maintenance responsibilities, and be aware of local pet policies and restrictions.