League City, TX, USA apartments for rent

$2,500
$2,500
Available: Right Now
Charming 1-story home in the Marbella Community , walking distance to the education village ! This spacious 3/4 bedroom and 2 bath home features an Open floor-plan with tile and wood flooring throughout! Enjoy breakfast at the kitchen i...

$3,200
$3,200
Available: Right Now
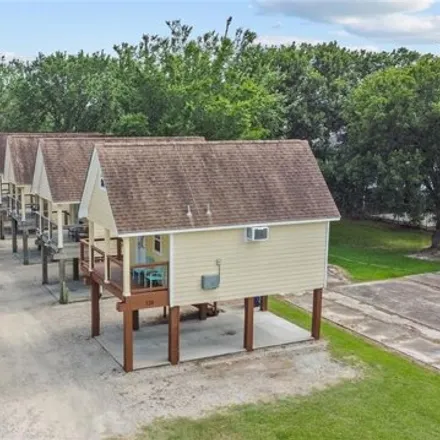
Fully furnished home in exceptional 538-acre master-planned community of Edgewater- nestled in the Bay Area. Streets adorned with flourishing palm trees, creating a picturesque atmosphere. Close proximity to Clear Creek and Galveston, allowing for a ...

$2,700
$2,700
Available: Right Now
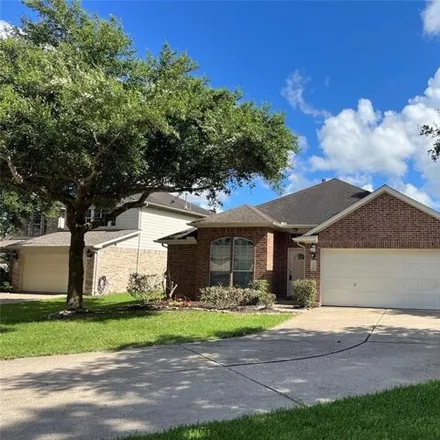
Beautiful 2 story home features builder upgrade front elevation with covered brick front porch. This 4 bedroom home offers primary suite downstairs with luxury vinyl plank, primary bathroom includes jetted tub, upgraded seamless shower and dual vanit...

$2,750
$2,750
Available: Right Now
Extraordinary water views of the SSH Marina from the 1st and 2nd story! 2 bdrm, 2.5 bath home with 2 parking spaces in the covered underground garage. Main level: Light and bright spacious kitchen with lots of storage, under cabinet lighting, instant...
$3,060
$3,060
Available: Right Now
A charming retreat located in Friendswood, Texas. You will enjoy a 50-inch television with Netflix, Hulu, and Disney+, and a washer and dryer on site. You will enjoy a state-of-the-art fitness center, swimming pool, and BBQ grills on the property, an...

$3,929
$3,929
Available: Right Now
Renovated house and garage on a large corner lot with lots of parking and space for 3 offices, the corner office has full bath, there is also a large conference room, huge eat-in kitchen, and reception area. There is a wheelchair ramp to the front en...

$7,110
$7,110
Available: Right Now
Our suite in Houston is perfect for your next stay! Start your day with a free breakfast and go for a swim in the outdoor pool. Amenities you're sure to love include:Studio with 1 Queen bedSelf-serve laundry facilities and in-house d...

$2,600
$2,600
Available: Right Now
Discover the perfect blend of elegance and practicality in this lovely 4-bedroom rental home in the sought-after Heritage Park area. With spacious living areas, a beautifully landscaped yard, and modern amenities throughout, this property is sure to ...

$2,975
$2,975
Available: Right Now
Great 4 bedroom home with all the upgrades! If you are looking for a new home. come see this one.. you will not be disappointed! From the draperies, light fixtures, hand scrapped wood flooring, huge pie shaped lot with no back neighbors, stone firepl...
$1,695
$1,695
Available: Right Now
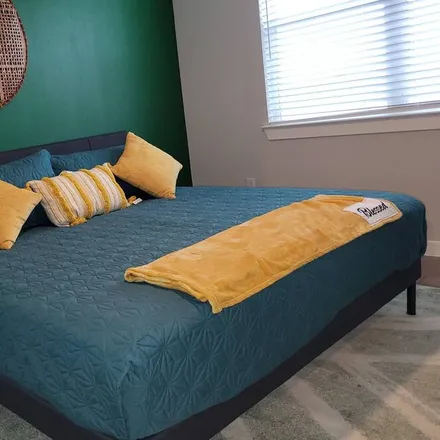
Fully furnished corporate rental cottage over looking Portofino Marina in Kemah Texas. All utilities are included in rent including WIFI, electric, water, trash pick up and lawn care. There is a detached laundry building with coin op machines open 24...

$2,100
$2,100
Available: Right Now
Come tour this cute home located in the great Clear Creek ISD school district on a cul-de -sac lot. The kitchen comes equipt with updated appliances, cabinets, light fixtures, and granite countertops. The open concept living room is perfect for enter...

$1,750
$1,750
Available: Right Now
Great location in quite neighborhood near elementary school. 3 bedroom 2 bath home with many updates. Tiled flooring, granite countertops, ceiling fans, and storm windows. Big backyard with deck and patio. Home is available for move in7/1/24.One pet ...

$1,800
$1,800
Available: Right Now
Beautiful 3/2 on a nice corner lot. Fresh Paint, Nice corner fireplace in large Living area, Kitchen with Breakfast, Garage is turned into an additional room, nice size rooms with closet space, and lovely back covered patio with fenced in back yard. ...

$2,450
$2,450
Available: Right Now
This wonderful home is located on a cul-de-sac and features 3 bedrooms, a home study, 2 bathrooms, a 2-car garage, a formal dining room, and a kitchen with a breakfast bar. The split floor plan includes a spacious entryway with high ceilings. The ope...

$3,900
$3,900
Available: Right Now
The minimum stay at this property is 3 months Luxury Executive Apartment is a gorgeous resort-style gated-community complex ,master planned community in League City, Texas. which is also home to the spacious South Shore Harbour Resort & Conference Ce...
$1,995
$1,995
Available: Right Now
Fully furnished 3 bedroom ( Possibly 4 ) 2 bath with 2 car garage with xtra wide/long driveway. master bath with jacuzzi tub and other bath has shower. Refrigerator, washer, and dryer included. Fenced backyard with picnic table a...

$1,990
$1,990
Available: Right Now
This single-story League City rental home has lots of charm. An immense fireplace with a floor-to-ceiling brick surround serves as the focal point of the living room. An exposed white beam and a hanging ceiling fan add a touch of luxury, and a sizabl...

$1,350
$1,350
Available: Right Now
Adorable 1 bed, 1 bath ground-floor unit with stainless appliances. The living room, dining room, breakfast bar, and kitchen seamlessly flow in this open-concept floor plan. This clean and airy unit has two adorable patio spaces- one off the bedroom ...

$14,490
$14,490
Available: Right Now
This luxurious home is just down the road from the Kemah Boardwalk, a perfect location for those looking for a tranquil escape but still very close to everything. This home offers an abundance of amenities for the perfect getaway experience including...

$3,000
$3,000
Available: Right Now
Immerse yourself in lakeside luxury with this exquisite property boasting modern amenities, a private backyard, and easy garage access. This nearly new home features two primary bedroom suites, a spacious study, and high ceilings for a perfect blend ...

$1,900
$1,900
Available: Right Now
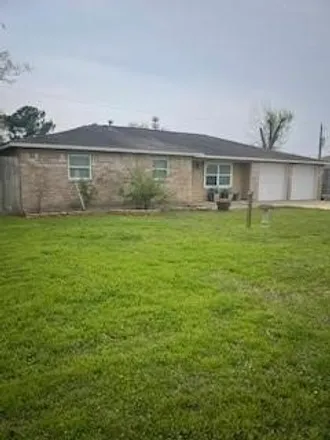
Spacious 4-bedroom home ideal for gatherings and outdoor cookouts in the large back yard. Flooring, kitchen, and baths have been updated in recent years. Perfect location for easy commutes to Galveston or Houston via nearbyIH-45.Close proximity to ex...
$2,300
$2,300
Available: Right Now
Outstanding opportunity to live on a 1/3 acre cul-de-sac lot! This charming home has been painted in a neutral grey palette, and is ready for a quality tenant. You will love the open floor plan. Living room, breakfast room, formal dining or a nice of...
League City
League City, TX has a population of 98,215, while the median age is 35. The household income in League City, TX is around $100,996. The homeownership rate among the residents is 73%. The median residential property value in League City, TX that you should keep in mind is $218,900.
| Population | 98,215 |
| Median Age | 34.6 |
| Poverty Rate | 6% |
| Household Income | $100,996 |
| Number Of Employees | 50,908 |
| Median Property Value | $218,900 |
What is the Average Rent for League City, TX Apartments?
The average rent for apartment in League City, TX: $2,360
(+10.6%)
| Month | Median Price |
|---|---|
| Jun 2024 |
$2,440
|
| May 2024 |
$2,407
|
| Apr 2024 |
$2,424
|
| Mar 2024 |
$2,424
|
| Feb 2024 |
$2,424
|
| Jan 2024 |
$2,424
|
| Month | Median Price |
|---|---|
| Jun 2024 |
$2,360
|
| May 2024 |
$2,134
|
| Apr 2024 |
$2,447
|
| Mar 2024 |
$2,447
|
| Feb 2024 |
$2,447
|
| Jan 2024 |
$2,447
|
Be informed and make custom offers based on median rent prices. However, keep in mind that the price may vary depending on the size and amenities of the apartments for rent.
Renter's FAQ About League City, TX
-
How can I find apartments for rent in League City?
There are several ways to find apartments for rent in League City. You can start by searching online using reliable rental platforms like Rentberry, which provide a wide range of listings in the area. You can also drive around the city and look for "For Rent" signs or check local newspapers for rental listings.
-
What types of properties are available for rent in League City?
In League City, you can find various types of properties available for rent, including apartments, houses, rooms, and condos. Whether you're looking for a cozy studio apartment or a spacious house with a backyard, you'll find options that suit your needs.
-
What are some popular amenities available in rental properties in League City?
Rental properties in League City offer a range of amenities to enhance your living experience. Popular amenities may include student-friendly features, such as proximity to universities and study areas. Other common amenities may include a dishwasher for convenience, parking options for residents and guests, air conditioning to beat the Texas heat, and gardens for those who enjoy nature.
-
What are the advantages of renting an apartment in League City?
Renting an apartment in League City offers several advantages. Firstly, you have the flexibility to choose from a variety of neighborhoods and properties that suit your lifestyle and budget. Secondly, apartment living often includes amenities such as swimming pools, fitness centers, and on-site maintenance, providing convenience and leisure. Lastly, renting eliminates the responsibilities of homeownership, allowing you to focus on enjoying your time in the vibrant community of League City.