Manchester, CT, USA apartments for rent

$2,500
$2,500
Available: Right Now
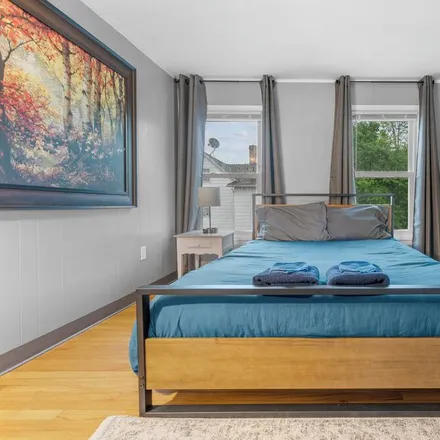
WOWZA Dont miss this updated modern, Stylish 3brm 2.5 bath Townhome Upon entry, you're welcomed into a charming and airy living space illuminated by natural light streaming through expansive windows, accentuating the light wood flooring. The kitchen ...

$1,500
$1,500
Available: Right Now
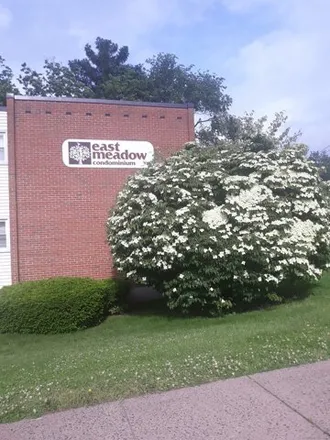
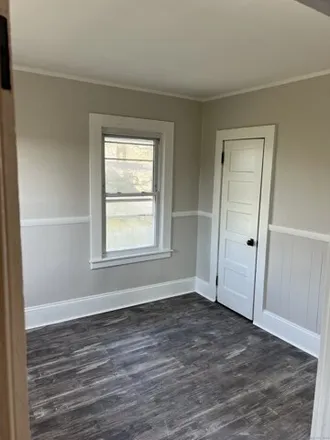
First floor - 2 bedroom - one bath apartment located in the center of Manchester. Features an eat in kitchen, hardwood floors and new vinyl plank flooring. White cabinets and granite countertops in kitchen. Nice quiet setting. Set back from street. W...

$2,100
$2,100
Available: 24/06/2024
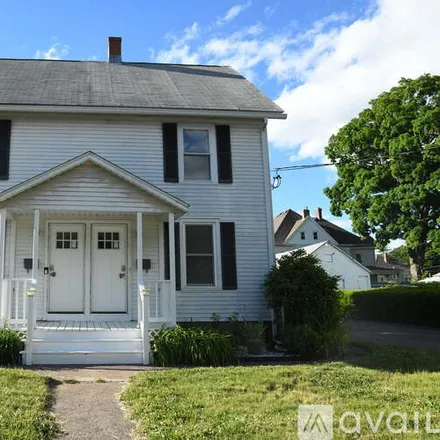
Be the first to rent this fully renovated and extremely spacious 3 bedroom, 1 bathroom apartment with brand new stainless steel appliances, hardwood floors and all new hardware and fixtures throughout. The kitchen shines bright with all new cabinetry...
$3,120
$3,120
Available: Right Now
Welcome to our Manchester 1-Bedroom Oasis! Our cozy apartment is the perfect blend of modern and elegance, with granite countertops, subway tile, stove/oven range, sub-compact fridge, and microwave. Explore downtown Main Street with local breweries, ...

$2,100
$2,100
Available: Right Now
Sought-after Oak Forest Community ~ Open concept floorplan hardwood flooring on the first floor. The Living room has a fireplace, a sunroom off the back. Spacious kitchen with a front deck flowing to the dining room and living room. Upstairs you will...
$1,275
$1,275
Available: Right Now
Great layout in this 1 bedroom, 1st floor ranch unit. Nice size Bedroom with Large walk in closet. EZ care flooring in living room and dining area. AC units in Living Room and Bedroom. Nice clean apt, centrally located to shopping and bus line Laundr...

$9,270
$9,270
Available: Right Now
We are excited to host your memories here in this beautiful 4 bedrooms (all queen beds) and 2 full bath house. This unique house has 2 floors and each floor has a full bathroom and full equipped kitchen. This property works great for wedding parties,...
$2,400
$2,400
Available: Right Now
Rarely available Townhouse with an open floor plan spacious rooms, attached garage, gas heat central air , must have good credit, no exceptions ! Min credit score of 700 range is required, Sorry NO Dog's would consider 1 Neutered/spayed cat wi...

$1,900
$1,900
Available: Right Now
Don't miss out on this opportunity to live in comfort and style, with everything you need just steps away. Welcome to 22 Saint James St. Apt. K. This 2-bedroom end unit townhouse features hardwood floors, stainless steel appliances, and tons of natur...

$1,700
$1,700
Available: Right Now
BRIGHT and SUNNY Townhome Style 2-Bedroom, 1.5 Bath Now available ! Main level includes: Remodeled Kitchen (w/Granite Counters and SS Appliances), Half Bath, Dining and Livingroom Combo with sliders to back yard and Private patio ! Uppe...

$1,950
$1,950
Available: Right Now
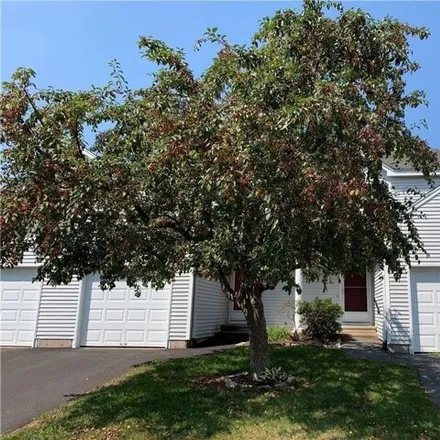
Charming 2-Bedroom End Unit Townhouse in Woodland Manor - Available July 1st! Discover your new home in this beautifully updated end-unit townhouse at Woodland Manor, featuring a new kitchen, updated bathrooms, new flooring, and fresh paint. The firs...
$2,300
$2,300
Available: 01/07/2024
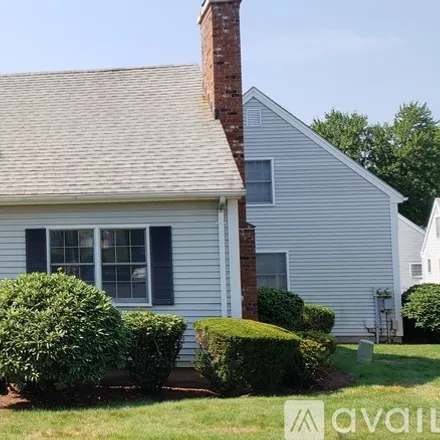
Free standing Cape Cod style condo with no shared walls is ready for you to unpack and enjoy quality at it's finest. If your looking for a single family home with the convenience of condo living this is aMUST SEE.Inside you'll find 6 rooms, 3 bedroom...
$1,475
$1,475
Available: Right Now
Recently remodeled second floor apartment, 2 bedroom 1 bathroom featuring private entry, front shared balcony space, and off street parking. Comfortable, convenient, and stylish apartment, this is an apartment home where you can relax. Plus, you're o...
$2,050
$2,050
Available: 29/06/2024
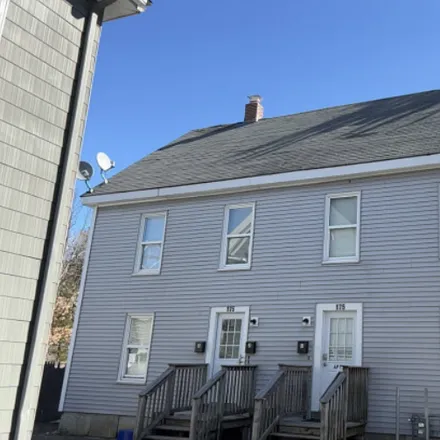
Welcome to your dream rental home in the heart of Manchester, CT! Nestled in a prime location, this duplex offers easy access to shopping, dining, parks, and entertainment. You'll appreciate the proximity to major highways and public transportation r...
$900
$900
Available: Right Now
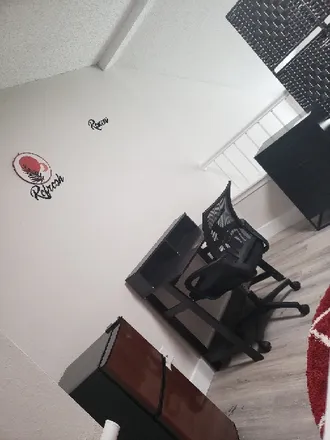
[3 months minimum stay - Suitable for a single person]Fully furnished Loft in newly renovated unit with a huge walk-in closet, brand new sofa bed equipped with storage compartment, USB outlets and cupholders awaits you in a very nice community. B...
$1,900
$1,900
Available: Right Now
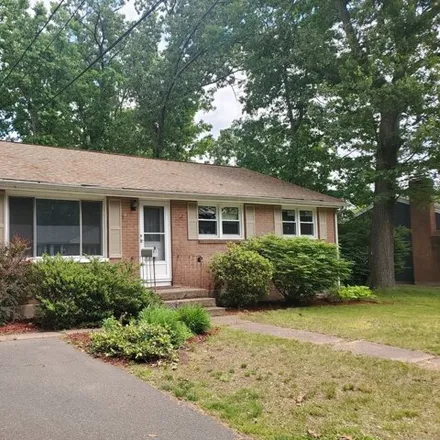
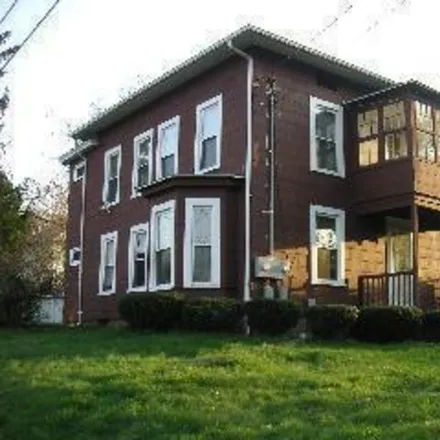
Well maintained 3 BR, 1Bath Ranch on a quiet street yet convenient, walking distance to shopping, schools, banks and public pool. Formal Living room with fireplace. Kitchen, fully applianced and open to the dining area. All 3 bedrooms are good sized....

$4,200
$4,200
Available: Right Now
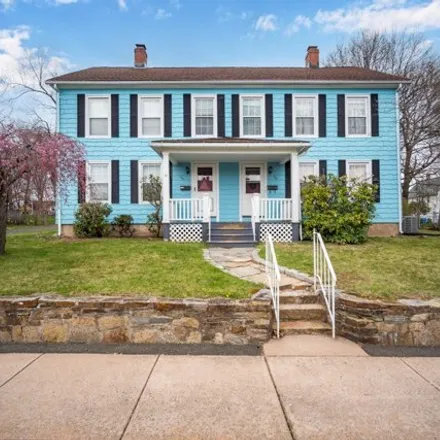
This stunning 2010 Colonial is the home you have been waiting for! Upon entering you will find the grand entryway filled with natural light, with full height ceilings and a beautiful wrap around staircase. Adjacent to the entrance is an office space ...

$2,000
$2,000
Available: Right Now
Recently remodeled 3BR unit with a bath and a half. The kitchen and baths have all been redone and there is laminate floor in the kitchen and carpet throughout the rest of the apartment. This property is located in a nice residential area and has a l...
$3,850
$3,850
Available: Right Now
Welcome to your beautiful new Townhouse style home at 175 Saint John Street in Portland, ME! This spacious four bedroom two bath apartment in the very desirable Portland West End. Tucked in the back of a quite neighborhood the apartment is Convenient...

$2,200
$2,200
Available: Right Now
Westage at South Windsor is conveniently located off Pleasant Valley Road in S. Windsor, minutes from Evergreen Walk, Buckland Hills Mall, Burr Corner Mall, Plaza at Buckland Road, near entrances to I-84 East/West and 291 East/West. Nearby Nevers Par...
$1,850
$1,850
Available: Right Now
Welcome to your cozy haven in Manchester, CT! This charming half duplex offers an inviting retreat with the perfect blend of comfort and convenience. Featuring 2 bedrooms, 1.5 bathrooms, and the added luxury of central air conditioning, this well-app...
$750
$750
Available: Right Now
My name is Leandra and my home is 1.25 ml away from central Manchester. I have 2 Singles and 1 Double room available to homestay guests. Leandra is 46. She speaks English and Greek and enjoys sports, cooking, watching movies, reading, learning fo...
Manchester
Manchester, CT has a population of 30,364, including 62% white, 18% latino, and 16% black.
| Population | 30,021 |
| Median Age | 35 |
| Poverty Rate | 13% |
| Household Income | $56,339 |
| Number Of Employees | 15,530 |
| Median Property Value | $166,000 |
What is the Average Rent for Manchester, CT Apartments?
The average rent for apartment in Manchester, CT: $2,368
(-30.4%)
| Month | Median Price |
|---|---|
| May 2024 |
$2,092
|
| Apr 2024 |
$3,573
|
| Mar 2024 |
$3,573
|
| Feb 2024 |
$3,573
|
| Jan 2024 |
$3,573
|
| Dec 2023 |
$1,763
|
| Month | Median Price |
|---|---|
| May 2024 |
$2,368
|
| Apr 2024 |
$3,400
|
| Mar 2024 |
$3,400
|
| Feb 2024 |
$3,400
|
| Jan 2024 |
$3,400
|
| Dec 2023 |
$2,037
|
Be informed and make custom offers based on median rent prices. However, keep in mind that the price may vary depending on the size and amenities of the apartments for rent.
City Overview
The median household income in Manchester, CT is around $55,875, while the median age is 34.1. This city is a home to major universities: n/a, n/a, and n/a. 15,611 employees work in Manchester, CT. The homeownership rate among the residents is 55.27%. The median property value that you should keep in mind is $167,700.