Muncie, IN, USA apartments for rent

$800
$800
Available: 01/08/2024
All utilities included in price $800 (Electric, Internet, Gas, Water, trash, & Sewage) Are paid by the landlord . Amazing well maintained 1 bedroom, living, bathroom and kitchen apartment in Muncie hardwood floors. The kitchen has m...
$5,940
$5,940
Available: Right Now
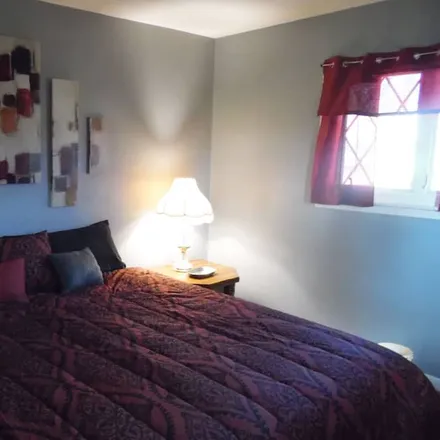
Quiet retreat in friendly neighborhood close to Ball State University. Close to restaurants, grocery stores and various shopping locations.Wineries, and Breweries near by.The spaceThe space is a very comfortable place to end a long day. C...
$1,450
$1,450
Available: 20/07/2024
Available now!Newly renovated home located on a corner lot with a large privacy fenced back yard near BSU campus. Small pet friendly (subject to approval). Located on a large corner lot, this property has a huge backyard with a privacy fence....

$5,160
$5,160
Available: Right Now
✶ Centrally located one block off the Main Street✶5 min to Ball State University✶10 minutes to IU Health Ball Memorial Hospital✶Covered parking under carport✶Fenced in back yard✶Office desk and chair✶Smart TV’s(BYO password)...

$1,975
$1,975
Available: 01/09/2024
Beautiful Modern Farmhouse Home in The Village – Fully Remodeled with Stylish Design This home is anything but average! Are you a discriminating renter looking for a stylishly updated single-family home available for rent in central Muncie? L...
$18,480
$18,480
Available: Right Now
Welcome to our beautifully remodeled 5-bedroom, 3-bathroom home in the heart of Muncie, Indiana! This spacious and stylish property is the perfect retreat for families or groups looking to explore the charming city of Muncie.Each of the five bedr...

$3,570
$3,570
Available: Right Now
This 120 year old home has some vintage mixed with lots of new updates. The home has been painted inside, along with new flooring and an updated kitchen. The laundry area has been newly updated making the space easier to access the home from the back...

$14,610
$14,610
Available: Right Now
Welcome to our charming rental nestled in the heart of Muncie, Indiana. Just 2-3 mins from IU Health Ball Memorial Hospital, Ball State University, and downtown Muncie. Enjoy a fully equipped kitchen, pool table game room, hotel quality linens and st...
$1,200
$1,200
Available: Right Now
Great location. 3 minute drive to the heart of Ball State campus. Close to many food and shopping options. Basement provides extra storage. There is a screened in back porch and fenced-in back yard. All applicants are required to complete a credi...

$1,335
$1,335
Available: Right Now
Best location in Ball State!!! Closet apartment building immediately adjacent to campus! This building is located in the Village just a block from McKinley and University. Walking distance to class, restaurants, and shopping. 3 bedroom unit includes ...

$3,600
$3,600
Available: Right Now
Our home is located in a quiet area not far from local restaurants and shopping. Looking for coffee just walk to the local Dunkin or Starbucks for your morning cup of jo. The greenway is close by for a fun day exploring. Restaurants are within walkin...

$2,730
$2,730
Available: Right Now
Escape to this charming bungalow in picturesque Muncie. With 2 cozy bedrooms, including 1 queen bed and 1 full bed, this enjoyable retreat is perfect for a relaxing getaway. Immerse yourself in the inviting ambiance and make use of the provided ameni...

$7,140
$7,140
Available: Right Now
The Petite Retreat has everything you would want or need in a 360 square foot tiny home. It sits back off the road on a large lot shaded by a 100 year old Oak tree. The high vaulted ceiling is beautiful and has a full kitchen to cook in, equipped wit...

$9,510
$9,510
Available: Right Now
Downtown DelightOur calendar is updated in real-time & our nightly rates are accurately displayed. Simply enter your desired dates and click 'Book Now!'Are you looking for the perfect home away from home for your next escapade with family and...

$400
$400
Available: Right Now
Hello everyone! My name is Kaelyn Shively. I’m a second year (soon to be third year) in the audiology program at Ball State and I am currently looking for one more roommate for next school year! My parents and I bought a house in Muncie a little ...

$13,350
$13,350
Available: Right Now
Introducing our premier midterm rental accommodations tailored for discerning travel medical professionals, traveling executives, and individuals seeking temporary housing solutions. Each meticulously curated unit boasts a newly remodeled interior, c...

$800
$800
Available: Right Now
Property is located in a beautiful prime quiet area, and is also very close to all major Freeways (110 FWY / 10 FWY) Very close to USC campus and various restaurants.Private Room is available for immediate move in. Owner is very flexible with lea...
$4,650
$4,650
Available: Right Now
our country home is located south of town and close to state road 3.u will love our spacious home with 3 bedrooms; 2 full baths; living room and family rooms.smart tvs throughout the home.spacious stainless steel appliances in the kitchen...

$4,770
$4,770
Available: Right Now
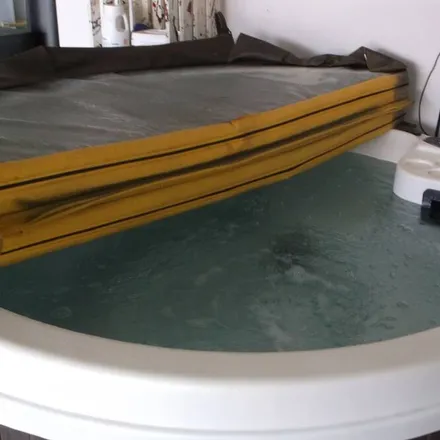
our country home is close to town in south muncie close to state road 3 and muncie bypass.enjoy our year round hot tub in garage.front yard is fenced in for your pet.house sits on over 2 acres with fruit trees and lots of shade.entire...
$3,960
$3,960
Available: Right Now
Our 2 bedroom, 2 bathroom condo is on lakefront at sandpiper lake condos.we are a few blocks from mcgalliard rd(sr 332).Inside there is one br up and one down .bath up and down also.up is the kitchen; dining; living room and bedroom a...

$649
$649
Available: Right Now
Experience luxury living at Yugo Muncie Varsity House! I'm looking for someone to take over my lease for the school year, with a private room in a fully furnished 2-bed apartment that offers upgraded amenities like an in-unit washer and dryer, outdoo...

$8,460
$8,460
Available: Right Now
About this spaceWelcome to a fun getaway in beautiful Muncie, Indiana! This stunning 4 bedroom, 2 bathroom house is perfect for families. With a gourmet granite kitchen that's fully stocked with cafe appliances, a tiki area with outdoor swings, a...
Muncie
Muncie, IN has a population of 69,237, while the median age is 29. The household income in Muncie, IN is around $32,372. The homeownership rate among the residents is 51%. The median residential property value in Muncie, IN that you should keep in mind is $70,500.
| Population | 69,237 |
| Median Age | 28.8 |
| Poverty Rate | 30% |
| Household Income | $32,372 |
| Number Of Employees | 31,625 |
| Median Property Value | $70,500 |