Norwood, MA, USA apartments for rent

$2,700
$2,700
Available: 04/08/2024
54 Savin Ave, #1, Norwood - 1 Bedroom, 1 Bath- $2700Available for an August4, 2024occupancy.Spacious, nicely updated 2 bedroom first floor apartment featuring a living room, updated eat in kitchen (w/stainless appliances, quartz counters, gas...

$3,000
$3,000
Available: 01/08/2024
Comfort and elegance! This luxurious three-level townhouse features 2 spacious bedrooms and 2 full bathrooms, complemented by a generous 1-car garage with extra storage space another 1 car parking, and plenty of guest parking space. Inside, enjoy the...

$2,400
$2,400
Available: Right Now
The home boasts approximately1, 100square feet of living space, providing ample room for relaxation and entertainment. The kitchen is spacious and modern, featuring new appliances and plenty of storage space. The bathroom has been recently renovated ...

$2,800
$2,800
Available: Right Now
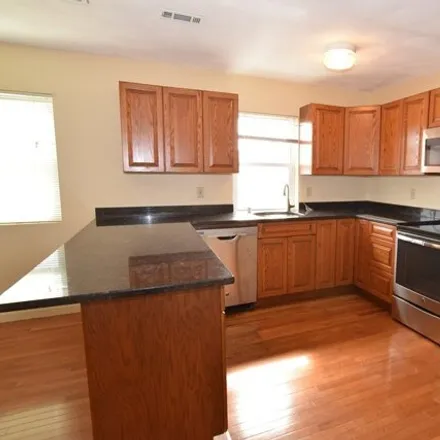
Wonderful remodeled first floor spacious apartment in great location. Large eat-in kitchen with brand new white cabinets, granite and stainless steel appliances. The kitchen opens into the formal dining room which leads to the large family room with ...
$2,200
$2,200
Available: Right Now
Wonderful location for this second floor apartment! Spacious beautifully new kitchen with granite counters, stainless steel appliances opens to a grand and comfortable family room. Updated bathroom and marble floors. Hardwood floors throughout. Centr...

$1,900
$1,900
Available: Right Now
3rd floor very clean apartment for rent, $1900per month includes heat, hot water, electricity and furnished if you want. Hardwood floors throughout, mini split central AC and Heat, separate entrance and parking. located a short walt to the T, shoppin...
$3,000
$3,000
Available: Right Now
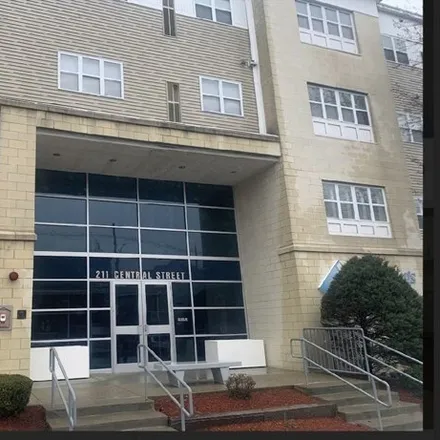
Beautiful 2 bedroom, 2 bathroom apartment for rent at The Crossings. Open concept living room, dining room, and kitchen. Updated kitchen with new quartz counters and stainless steel appliances. Two large bedrooms which both feature spacious bathrooms...

$3,510
$3,510
Available: Right Now
***32 Nights Avoids Occupancy Tax***Comfortable executives' condo, tastefully furnished with quality pieces, a front to back townhouse style offers plenty of light and easy access. Amenities include all you would need for a stay of any length, wi...

$3,500
$3,500
Available: Right Now
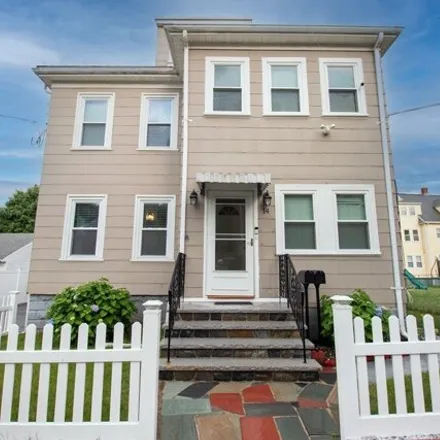
This charming corner lot Cape style home, situated across from Shattuck Park is ready for you. Private fenced-in backyard on a level lot. Eat-In kitchen with stainless steel appliances. The house comes fully furnished, for your convenience. The attic...

$2,750
$2,750
Available: Right Now
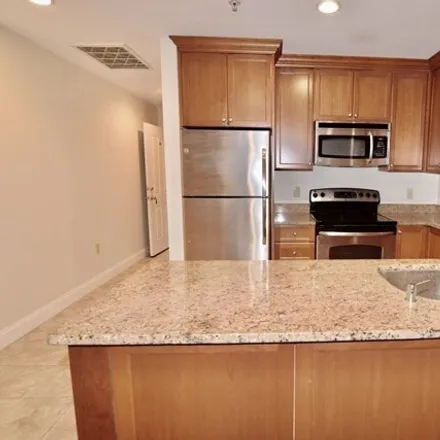
Discover your new home in this charming and spacious 3- BR apartment. The inviting residence features an open layout encompassing the living room, dining room, and kitchen areas, perfect for entertaining and everyday living. The kitchen boasts granit...
$2,500
$2,500
Available: Right Now
Beautiful and well maintained 1st floor apartment now available and ready to be moved into today! Updated kitchen with stainless steel appliances and brand new gleaming floors throughout. Convenient location with off-street parking and outdoor yard s...

$2,300
$2,300
Available: Right Now
Seasonal water view. Private end unit. Very rare offering! 2 bedroom 2 full bath condo with a direct walk out, no stairs. Located at River Oaks-the most convenient complex in Town. Perfect commuters dream; less than 2 miles to route 95 and mile to th...

$4,000
$4,000
Available: Right Now
Rental available now at River Village! This absolutely amazingly beautiful Fully furnished two bedroom, two bathroom condo is in a fabulous location, with easy access to the Canton Junction MBTA Station and I-95. Features in unit washer and dr...

$2,400
$2,400
Available: Right Now
Discover your new home in this charming and spacious 2- BR apartment. The kitchen boasts granite countertops with a breakfast bar, wood cabinets, ceramic tile flooring, and stainless steel appliances. Enjoy HW floors throughout the apartment, with ce...

$2,100
$2,100
Available: Right Now
Look no further! Sun-filled 2-bedroom condo with parking (1-2 spots) at well-kept and managed Brookhill Condos. Features newer flooring throughout, eat-in kitchen and laundry on site. Also newer windows throughout keeping utility costs at a reasonabl...

$990
$990
Available: Right Now
This is office space. Calling all tutors, therapists, consultants, accountants, bookkeepers, and more! Seize the opportunity to elevate your business with a new office space located in the heart of Norwood. This inviting space offers a host of...

$2,400
$2,400
Available: Right Now
Spacious first floor unit with hard floors , 2 bedrooms, full bath, kitchen with pantry, and, office, Washer dryer and semi finished rec room in the basement. Short walking distance to bus stop on Washington street. Convenient location to all. Water ...

$2,500
$2,500
Available: Right Now
Newly renovated apartment in quiet area of Norwood near the High School....walkable to City center, stores and commuter rail. This 2 bedroom with one bathroom unit has been tastefully renovated with new kitchen and granite countertops, fresh paint, a...
$2,500
$2,500
Available: Right Now
Luxury living! Cherry Custom Kitchen with granite counter open dining and living space provides flexibility with the layout. Hardwood floors throughout. Master bedroom has a huge walk-in closet and a large bathroom with granite and tile floors. Air-c...

$2,400
$2,400
Available: Right Now
Renovated to the studs ! Just a few more weeks as you can see in the photos and it will be ready for its new tenants! This fabulous first-floor, 2-bedroom apartment within a charming 3-family house has received so many updates: all new applian...

$2,400
$2,400
Available: 01/08/2024
47 Chapel St, #29, NorwoodAvailable for an September1, 2024occupancy.Heat and Hot Water Included!Sunny 2 bedroom top floor apartment (no elevator) available with hardwood floors, refrigerator, dishwasher, off street parking, coin-op laund...
$2,600
$2,600
Available: Right Now
Two Bedroom condo for rent at desirable Williamsburg Condominium Complex in Norwood! Awesome Commuters location 1/2 mile from Norwood Commuter Rail! Minutes to Routes1, 95, 128.Modern kitchen with stainless dishwasher, stove and microwave, along with...
Norwood
Norwood, MA has a population of 29,121, while the median age is 41. The household income in Norwood, MA is around $87,516. The homeownership rate among the residents is 58%. The median residential property value in Norwood, MA that you should keep in mind is $402,600.
| Population | 29,121 |
| Median Age | 40.6 |
| Poverty Rate | 8% |
| Household Income | $87,516 |
| Number Of Employees | 16,223 |
| Median Property Value | $402,600 |
What is the Average Rent for Norwood, MA Apartments?
The average rent for apartment in Norwood, MA: $2,099
(-8.9%)
| Month | Median Price |
|---|---|
| Jun 2024 |
$1,537
|
| May 2024 |
$1,872
|
| Apr 2024 |
$1,992
|
| Mar 2024 |
$1,992
|
| Feb 2024 |
$1,992
|
| Jan 2024 |
$1,992
|
| Month | Median Price |
|---|---|
| Jun 2024 |
$2,099
|
| May 2024 |
$2,304
|
| Apr 2024 |
$2,283
|
| Mar 2024 |
$2,283
|
| Feb 2024 |
$2,283
|
| Jan 2024 |
$2,283
|
Be informed and make custom offers based on median rent prices. However, keep in mind that the price may vary depending on the size and amenities of the apartments for rent.