Richland, WA, USA apartments for rent

$5,700
$5,700
Available: Right Now
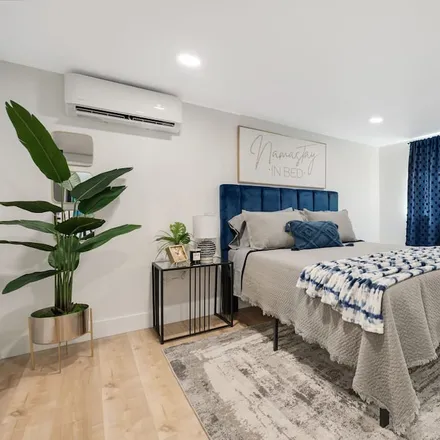
Beautiful home located in a quite neighborhood with quick access to the the Columbia River walk. The property has river views with close by restaurants and shopping. Located in Tri-cities Research District. The Master bedroom has a king sized bed...

$5,610
$5,610
Available: Right Now
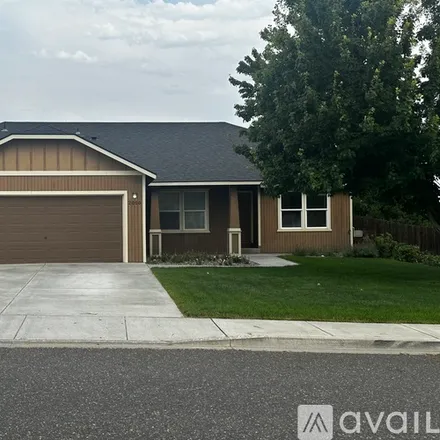
Seeking a small-town getaway filled with thrilling adventures and outdoor recreation? You'll love this 3-bedroom, 2-bath home in West Richland, WA! Ideal for families and friends, this vacation rental boasts a full kitchen, a modern living space, and...

$9,900
$9,900
Available: Right Now
Columbia VistaOur calendar is updated in real-time & our nightly rates are accurately displayed. Simply enter your desired dates and click 'Book Now!'Spectacularly situated on the banks of the Columbia River, this waterfront home in Richland ...

$1,000
$1,000
Available: 14/08/2024
Room only in safe and quiet neighborhood of $800k -$1+ million homes. All utilities and high speed internet are included. Beautiful furnished room has hardwood flrs, queen-sized bed, study nook, mini refrigerator, microwave, and stunning tree vie...

$4,620
$4,620
Available: Right Now
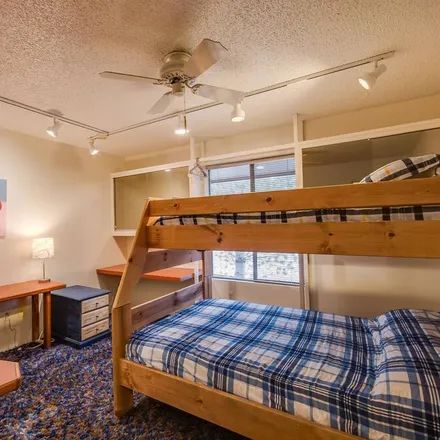
Lower level apartment in a Historic Gold Coast "Q" House in North Richland. Located near the Columbia River (3 blocks) where you can find walking paths, playgrounds, tennis courts and a boat ramp. Our home sleeps 5 with 2 queen bedrooms, 1 twin Daybe...

$2,100
$2,100
Available: Right Now
FOR RENT: 3bdrm, 2.5 bath 2-story luxury condo at Columbia Point in Richland. Open floor plan, gas fireplace in great room, expansive kitchen and nook with patio. Bedrooms on upper floor including large primary suite with balcony. Enjoy quiet living ...

$3,495
$3,495
Available: Right Now
For rent: mls #277334 This 2727 sq ft home West Village Subdivision in S. Richland built by JK Monarch homes has a bedroom for everyone! Guest suite on the main, with 4 bedrooms upstairs, tons on natural light, storage space, fine finishes, an...

$850
$850
Available: 17/07/2024
Un-Furnished room for long-term rentals (4-month term minimum) 🏷 $850 per month garbage and internet included. Water and electricity bills are split (1/5’s). Brand new (10-7 x 12-7) room never lived in -$850 security deposit is required.About the...
$2,400
$2,400
Available: 21/07/2024
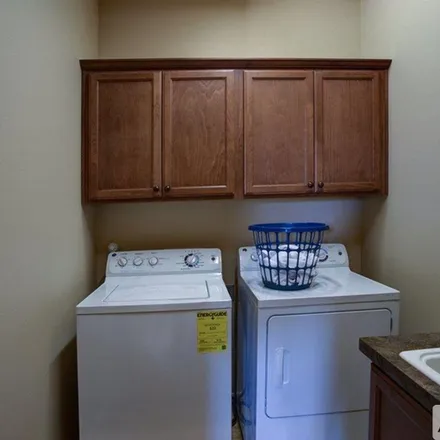
Stunning, clean, and bright townhouse for rent in Horn Rapids golf course. Home has spacious fenced backyard with trails for walks. Home comes with washer and dryer and two car garage. Home is in community with swimming pools, tennis courts, and ...
$2,200
$2,200
Available: 01/08/2024
3 bed 2 bath home in desirable West Richland neighborhood, with fenced backyard, UGS, and RV parking.3 bed2 bathWasher/Dryer hookups 2 car garage with remotesRV parkingFenced yardLarge patioUGSIrrigation1 year ...

$13,650
$13,650
Available: Right Now
This is the perfect rental if you're looking to work from home with relaxing peaceful views. This home is situated on one acre with a stunning view of the Mighty Columbia.Cook fantastic dinners in a fully equipped and well appointed kitchen with ...

$9,570
$9,570
Available: Right Now
Immerse your family in a delightful getaway at this stylish retreat in Richland, Washington, mere minutes from the renowned Goose Ridge Vineyards and charming local wineries. Our thoughtfully designed 3-bedroom, 2-bath home welcomes up to 8 guests, e...

$4,350
$4,350
Available: Right Now
Discover the best historic Richland home built during the Manhattan Project. This private home boasts 3 bedrooms, one bath, hardwood floors, walk in closets, updated appliances and a fully stocked kitchen,. All new beds and furnishings including a ne...
$7,830
$7,830
Available: Right Now
Completely remodeled home! 2 bedrooms, 1 bathroom with a luxurious vibe. High end appliances, furniture and decor. This home is as comfortable as it gets. From a soaker tub, to a large walk in shower, to upscale mattresses and decor! Fully fenced bac...
$7,260
$7,260
Available: Right Now
Beautiful and unique 4 bedroom, 3 bathroom house in a quiet neighborhood near the Columbia river in North Richland!Over 3,300 square feet with beautiful backyard and on the bike path through the neighborhood and along the river. Just blocks from ...

$4,350
$4,350
Available: Right Now
Single Family Home in a quiet peaceful neighborhood close to Chaparral park in South Richland.This home is 3 Bedroom, 2 bath with big driveway & additional off street parking. Each bedroom has a queen bed & TV. There is a fully stocked kitchen wi...

$6,210
$6,210
Available: Right Now
This cozy studio is 448 square feet, with all the amenities you will need! Full size appliance, soaker tub, walk in shower, washer/dryer AND a 10x10 "she shed" made into a private office if you're needing quite place to work. Completely remodeled and...

$2,499
$2,499
Available: Right Now
Fully furnished and all utilities included 2 Bedroom 2 Bathroom Meadow Springs Condo. This residence sits on the first green of the golf course. New appliances, washer/dryer, paint, and flooring! Covered parking also provided as well as access...

$6,450
$6,450
Available: Right Now
Come Sail Away in this beautifully appointed Richland home! This prime location is close to Hanford, vineyards, wineries, the Columbia & Snake Rivers, dining, entertainment, and much more. Step out of the cozy back patio area to enter a private park,...

$10,470
$10,470
Available: Right Now
Experience the beauty of Eastern Washington when you book this 3-bedroom, 2.5-bath vacation rental home in West Richland! Nestled on 1.5 private acres, steps from a 200-plant micro-vineyard, 'The Vineyard House' is the ideal place to unwind. Complete...

$9,720
$9,720
Available: Right Now
Newly updated, sparkling clean home in a beautiful tree-lined, quiet neighborhood. Conveniently located near Hanford, Columbia and Yakima rivers, downtown, various wineries, walking paths, and highway access. Plenty of space for up to 8 guests to...

$6,120
$6,120
Available: Right Now
3 bedroom 2 bathroom rambler located minutes from wine, restaurants, movies and stores. Keyless entry, access to 2 car garage and full size washer and dryer. Wifi, Netflix and Hulu.The spaceClean newly built home with new beds and furniture t...
Richland
Richland, WA has a population of 53,991, while the median age is 37. The household income in Richland, WA is around $71,025. The homeownership rate among the residents is 65%. The median residential property value in Richland, WA that you should keep in mind is $226,300.
| Population | 53,991 |
| Median Age | 36.5 |
| Poverty Rate | 10% |
| Household Income | $71,025 |
| Number Of Employees | 25,804 |
| Median Property Value | $226,300 |