Tigard, OR, USA apartments for rent
$1,300
$1,300
Available: 24/07/2024
Amazing 1 Bedroom, 1 Bathroom Apartment in TIGARD. *Only 1 unit Left!*14040 SW112th Ave , tigard, or Office phone#/TERESA or JOANNE* Available now **** Move in special 1/2 off 1st month ' S rent with s...
$13,560
$13,560
Available: Right Now
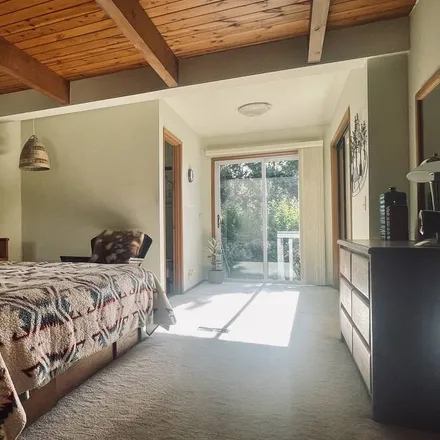
A true Mid Century Modern Gem with peaceful pond view from almost every room. Fully furnished with Danish pieces and Asian antiques to well preserve MCM vibes plus ZEN sprites. Vaulted ceiling, open floor plan with 3 bedrooms and 3 full bathrooms. En...

$1,500
$1,500
Available: 10/07/2024
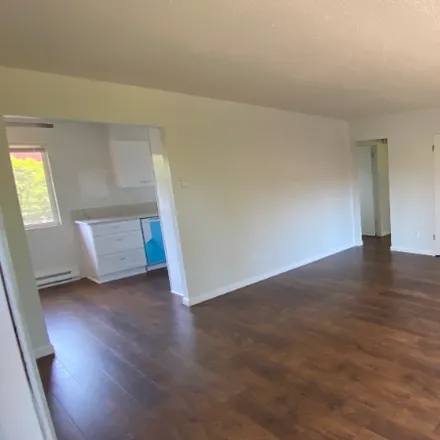
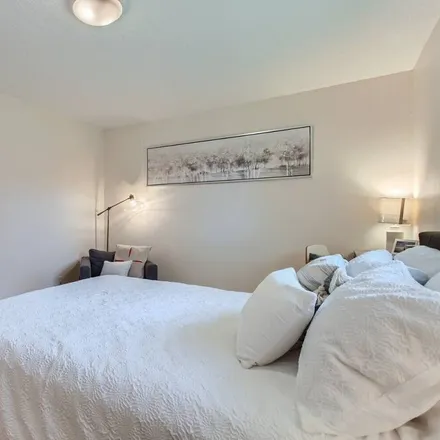
This completely remodeled gem is ready to be your dream home. Step inside and be greeted by a cascade of brand new features that will leave you speechless.Imagine:Fully remodeledGorgeous flooring underfoot, a pleasure for every step.S...
$1,200
$1,200
Available: Right Now
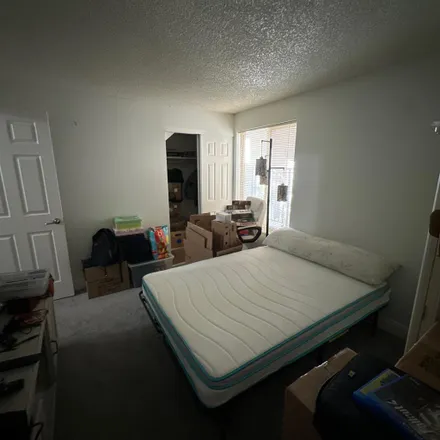
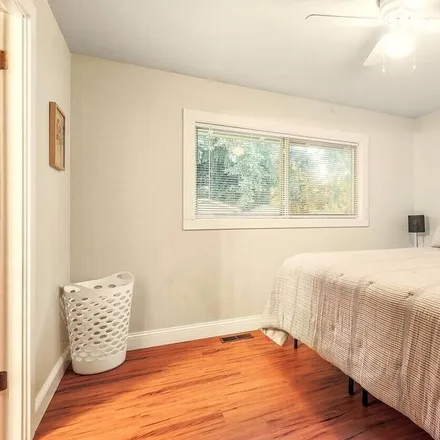
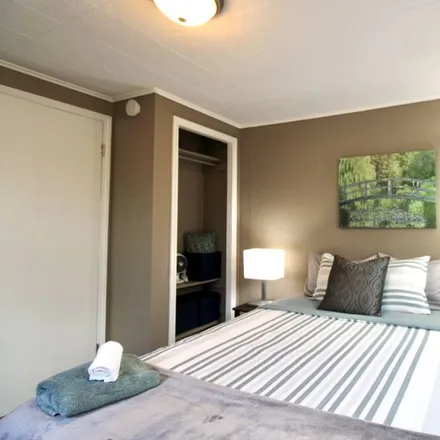
1 bedroom with deep closet & large bathroom ample space to share on occasion. Shared living spaces. Cleanish home. Laundry room in home, deck, parking spot, and pool on grounds. Follow HOA rules. Note* The Bedroom is currently pictured with items...

$11,850
$11,850
Available: Right Now
Summary:Discover a tranquil Portland escape with our unique property featuring a luxurious swim spa, large backyard with gazebo and fire pit, and interiors designed for comfort. Enjoy culinary adventures in our fully stocked kitchen and restful n...

$3,700
$3,700
Available: 01/08/2024
This exquisite 5-bedroom residence in the prestigious Bull Mountain area offers the perfect blend of elegance and comfort.Key Features: Spacious Bedrooms, large rooms throughout, with a main bedroom that boasts an expansive nursery area. Lots...

$5,220
$5,220
Available: Right Now
Located in the lower level of a 2-story home with a private entrance secured with a keypad lock. This quaint and stylish 2-bedroom 1 bath space is located in a very friendly neighborhood where residents enjoy walking and access to nearby trails, the ...
$5,220
$5,220
Available: Right Now
Just a few miles from downtown Portland, Tigard offers outdoor recreation and walkable neighborhood attractions. Explore the great outdoors on the Fanno Creek Trail, where you can hike, bike, and discover local wildlife. Or paddle down the Tualatin R...

$1,899
$1,899
Available: Right Now
Lovely Renovated 2 Bedroom Main House with a Full family kitchen and Dining Area. Laundry included!! Right off Davie Blvd & 27 Ave. Excellent, safe location for the family. Nestled in house in a very quiet street. While offer lasts.***Important: ...

$2,450
$2,450
Available: 26/07/2024
Experience luxury living in this beautifully designed 3-story townhouse. This home offers 2 spacious bedrooms with full en suite bathrooms, perfect for comfortable living. Enjoy a range of high-end amenities including a pool, gym, and a cozy fireplac...
$4,590
$4,590
Available: Right Now
3 bedroom, 1 bath home with seamless wooden floors throughout. Kitchen has a full size fridge, oven, dishwasher, and microwave- in addition to lots of amenities. Large bathroom with good layout; double sink, full tub shower combo, privacy wall for to...

$19,290
$19,290
Available: Right Now
Welcome to our luxurious 4-bedroom Vrbo rental, nestled in a serene neighborhood perfect for your vacation or getaway needs! With 3.5 baths, this spacious abode boasts a great big courtyard, ideal for outdoor relaxation and gatherings. Dog lovers...

$11,280
$11,280
Available: Right Now
Are you looking for a place for your family to enjoy Oregon? This is your place. The house is perfectly designed for a getaway with family or a big group of friends. 7 beds that can comfortably sleep 13 with the 14th person on the couch. A great ...
$6,540
$6,540
Available: Right Now
Welcome to your cozy retreat in the heart of Tigard! Unwind on the patio with a gazebo and outdoor seating, snuggle up on the deep-seat couch, and refresh in the full shower and bathtub. The modern kitchen has all the essentials, including coffee and...
$1,500
$1,500
Available: Right Now
Ditch the apartment hunt, find your sanctuary!This completely remodeled gem is ready to be your dream home. Step inside and be greeted by a cascade of brand new features that will leave you speechless.Imagine:Fully remodeledGorgeous f...

$6,930
$6,930
Available: Right Now
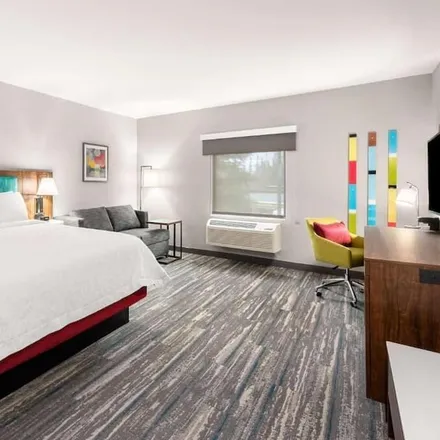
Our hotel is just offOR-217,across from tax-free shopping at Washington Square Mall. Downtown Portland, Nike HQ, and Intel’s campus are all about 15 minutes away. Our indoor pool and fitness center are open all day, and we offer a free shuttle to des...

$6,540
$6,540
Available: Right Now
This 3 bedroom 2 bath condo is the end unit that over looks the 18th green! The ground level floor boasts a large bedroom and full bath along with the living and brand new kitchen. All with large windows and private views. The back patio is a great e...

$5,670
$5,670
Available: Right Now
Just a few miles from downtown Portland, Tigard offers outdoor recreation and walkable neighborhood attractions. Explore the great outdoors on the Fanno Creek Trail, where you can hike, bike, and discover local wildlife. Or paddle down the Tualatin R...
$6,570
$6,570
Available: Right Now
Welcome to our inviting home! Our spacious home is nestled in a quiet and safe cul-de-sac, offering a serene escape for your stay. Here's what you can expect:Outdoor Oasis: Step into our large fully fenced yard, boasting a two-tiered water featur...

$3,495
$3,495
Available: Right Now
Beautiful 4 bedroom, 2.5 bath home in a highly sought after neighbourhood. It has Tesla solar panels installed on roof that means less monthly electricity bill. Good size two car garage with Epoxy flooring. Garage has a level 2 car charger and ample ...

$455
$455
Available: Right Now
Looking for a couple to take over my master bedroom by June rent , utilities, electric,internet per person everything split 3 ways great neighborhood close to Washington square mall, small dog or cat is ok. A do have a small kitten that I just adopte...

$4,620
$4,620
Available: Right Now
Welcome to the Cottage at River Run! Your private oasis nestled on 1.8 acres backing the Tualatin River.This cottage comfortably sleeps eight with an upper loft area with a full bed and two twin beds and views of the river! The lower level has a ...
Tigard
Tigard, OR has a population of 51,355, while the median age is 38. The household income in Tigard, OR is around $70,120. The homeownership rate among the residents is 60%. The median residential property value in Tigard, OR that you should keep in mind is $345,200.
| Population | 51,355 |
| Median Age | 37.7 |
| Poverty Rate | 10% |
| Household Income | $70,120 |
| Number Of Employees | 27,182 |
| Median Property Value | $345,200 |
Renter's FAQ About Tigard, OR
-
What types of properties are available for rent in Tigard?
In Tigard, you can find a variety of rental options including houses, apartments, rooms, townhouses, and more.
-
What are some popular amenities offered in rental properties in Tigard?
Rental properties in Tigard often come with amenities like air conditioning, parking, dishwashers, fireplaces, and elevators, depending on the type of property you choose.
-
Is public transportation easily accessible in Tigard?
Tigard offers convenient access to public transportation, including bus services and light rail options. The local transportation system provides easy connections to neighboring cities and downtown Portland.
-
What should I be aware of when renting an apartment in Tigard?
When renting an apartment in Tigard, it is important to carefully review the terms of the lease, understand the property's rules and regulations, and inspect the apartment thoroughly before signing any agreements. It is also recommended to familiarize yourself with pet policies, parking arrangements, and utility responsibilities.