Torrington, CT, USA apartments for rent
$1,400
$1,400
Available: Right Now
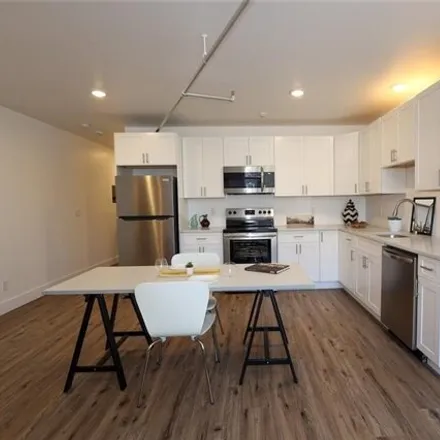
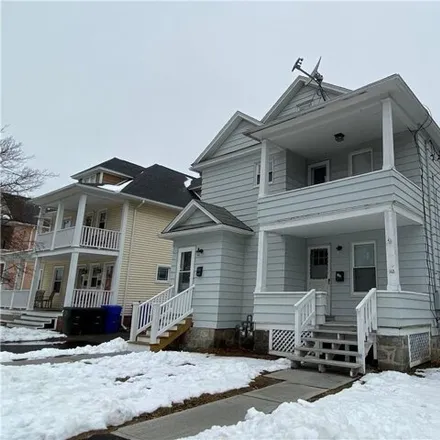
Discover this beautifully renovated second-floor unit featuring a 2-bedroom, 1-bath apartment situated in close proximity to all that Torrington has to offer. Upon entry, you're welcomed by a spacious kitchen with ample room for a practical eat-in ar...

$1,800
$1,800
Available: Right Now
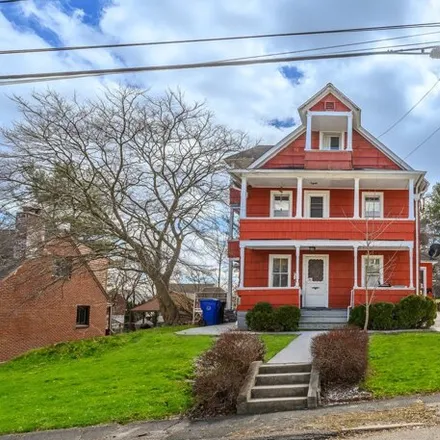
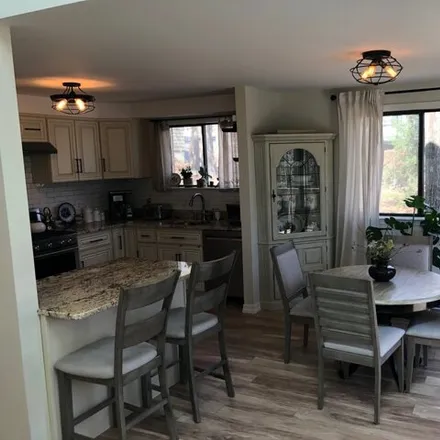
Completely remodeled 3 bedroom, 1.5 bath single family home on an easy to maintain lot! The main level of this spacious home features a gorgeous kitchen with custom subway tile backsplash and stainless steel appliances, a dining room, living room, pl...
$1,400
$1,400
Available: Right Now
2 units available December 1st! 1 for$1, 400,one larger front facing for$1, 600Be a part of the newest studio style apartments right here in the hub of Litchfield County. Completely brand-new units located in a refurbished historic building in...

$1,350
$1,350
Available: Right Now
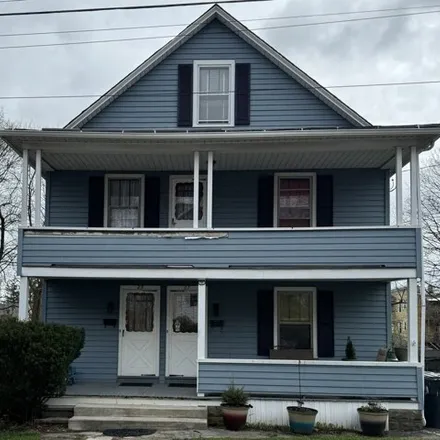
Spacious 2 bedroom, 1 bath apartment on the 1st floor of a well maintained home on the west side of town! This apartment features a large eat-in kitchen, 2 good sized bedrooms, a large living room/dining room, plus a bathroom with tub and shower. Lau...
$1,550
$1,550
Available: Right Now
Bright, sunny and spacious 2nd floor 2 bedroom apartment. New wall to wall carpeting in bedrooms, living room and dining room. Gas heat. Refrigerator and stove included. Washer hook-up in pantry. Front and back porches and a lovely back yard to enjoy...
$1,250
$1,250
Available: Right Now
Very spacious 1 bedroom third floor walk-up apartment. Light and clean with brand new oven and refrigerator. Two entrances. Keyless Entry. Carpeted in bedroom, living/dining room. Kitchen is vinyl flooring. Gas baseboard heating. One parking space in...
$5,100
$5,100
Available: Right Now
Charming, comfy entire 1st floor apartment. Recently renovated from the studs on up. Exceptionally clean. Just minutes from downtown Torrington. Catch a show at the Warner Theatre just minutes away. Two skiing mountains within half an hour. 10 minute...
$5,000
$5,000
Available: Right Now
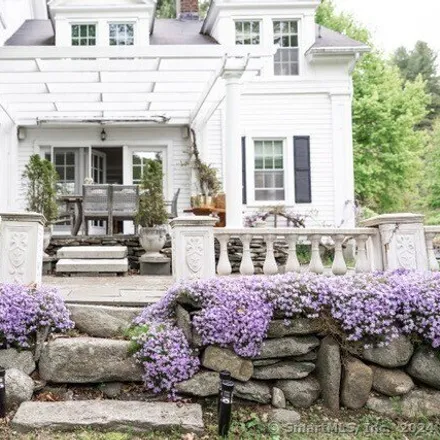
Idyllic summer retreat for rent. Completely furnished and historically significant Greek revival -- 4-bedroom farmhouse comfortably accommodates 6 to 8 guests. Situated on 10+ country acres, this rental features an inviting outdoor dining area overlo...
$6,000
$6,000
Available: Right Now
Spend your Summer at LakeRidge! NW CTs best kept secret. This totally remodeled end unit is fully furnished and appointed for complete efficiency. 3 bedrooms, one on first floor and 2nd and primary suite upstairs. One full bath on each level. Open co...

$7,080
$7,080
Available: Right Now
Stay comfortably in Litchfield County at this 4-bedroom condo. This condo features modern amenities like a washing machine and dryer, dishwasher, WiFi, AC, and a large TV. This spacious condo is the perfect home away from home. Situated in a gated co...

$1,800
$1,800
Available: Right Now
Beautiful, completely remodeled 1st floor 2 bedroom unit. This apartment was remodeled to current code requirements for plumbing, heating, and electrical. The owner went above and beyond and even added central heating and AC for extra comfort. This p...

$950
$950
Available: Right Now
Spacious 1 bedroom, 1 bath apartment on the west side of town! This unit features a kitchen, living room, bedroom, plus a full bath with a shower stall. Beautiful laminate flooring throughout and tons of natural light beaming in through the windows. ...

$1,800
$1,800
Available: Right Now
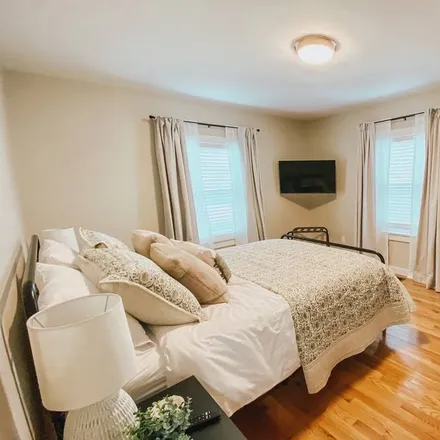
Discover modern living at 214 Cedar Ln in Torrington! This beautifully remodeled rental features two spacious bedrooms and one pristine bath, all adorned with elegant hardwood floors. The brand-new kitchen will be equipped with a brand new stove and ...

$1,100
$1,100
Available: Right Now
Explore this two-bedroom unit on the first floor in Torrington, CT. The unit includes roomy bedrooms and a generous living space, complemented with an eat in kitchen. Please note that the tenant will be responsible for all utilities, and a credit che...
$1,200
$1,200
Available: Right Now
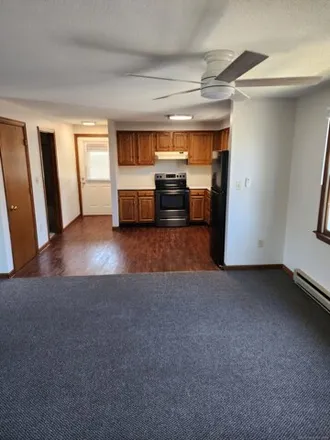
Nicely updated first floor features large living room with hickory wood flooring, 2 good sized bedrooms, one with hw flooring, one with carpeting, kitchen features newer appliances, gas heat and hot water, laundry in basement, parking for 2 cars off ...
$9,300
$9,300
Available: Right Now
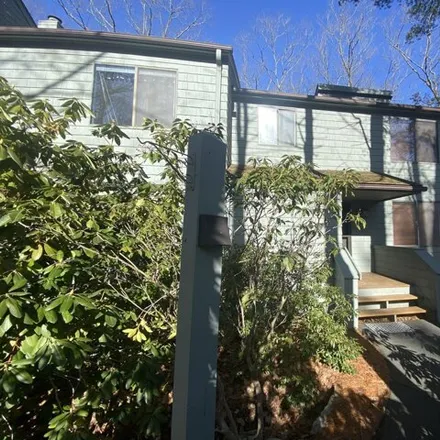
Stay over night for a show at the Warner, hike at White Memorial, Ski at Mohawk or go local antiquing. Relax alone or with the family at this peaceful place. 10 Min from Litchfield.Home was built at the end of the Victorian Period in 1900 and was...

$1,975
$1,975
Available: Right Now
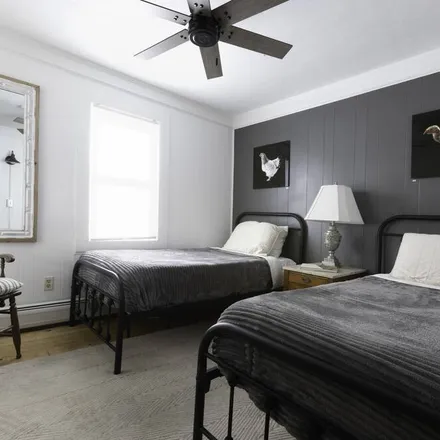
Charming 2 bedroom two bathroom cape for rent in Torrington is ready for new tenants! This property includes a fully applianced kitchen and living room on the main level with washer and dryer hookup in the basement. Proof of renter's insurance, first...
$2,400
$2,400
Available: Right Now
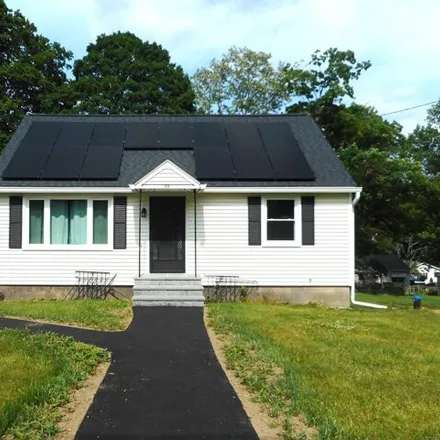
Completely remodeled 3-4 bedroom home available for rent immediately All utilities included in monthly rent !! Located on the West side on a no-through street, this sweet Cape style home has been completely remodeled from top to bottom. New ro...

$2,300
$2,300
Available: Right Now
Beautiful, completely remodeled 2nd/3rd floor 4 bedroom unit. This apartment was remodeled to current code requirements for plumbing, heating, and electrical. The owner went above and beyond and even added central heating and AC for extra comfort. Th...
$5,500
$5,500
Available: Right Now
Make this magnificent LakeRidge condo yourSUMMERdestination. Available during June, July, August and September. Book for up to 3 months! Fully furnished with wonderful artistic detail for your home away from home! One bedroom on main level with full ...

$1,100
$1,100
Available: Right Now
Immaculate one bedroom 1st floor apartment in sought after 12 unit building in North End of Torrington . no stairs to climb. Remodeled full bath, lots of closet space, open dining/living room with slider to back yard. Very clean shared basemen...

$1,375
$1,375
Available: Right Now
New Luxury Apartment Available for September 1st Located in the heart of downtown Torrington, an area which is quickly becoming the Artistic Hub of Litchfield County! 3rd floor 3 room, 1 bedroom apartment features a gorgeous new Kitchen with granite ...
Torrington
Torrington, CT has a population of 35,227, including 83% white, 10% latino, and 4% asian.
| Population | 35,078 |
| Median Age | 45.2 |
| Poverty Rate | 10% |
| Household Income | $61,313 |
| Number Of Employees | 17,847 |
| Median Property Value | $160,200 |
What is the Average Rent for Torrington, CT Apartments?
The average rent for apartment in Torrington, CT: $1,523
(+9.7%)
| Month | Median Price |
|---|---|
| Jun 2024 |
$1,463
|
| May 2024 |
$1,403
|
| Apr 2024 |
$1,497
|
| Mar 2024 |
$1,497
|
| Feb 2024 |
$1,497
|
| Jan 2024 |
$1,497
|
| Month | Median Price |
|---|---|
| Jun 2024 |
$1,523
|
| May 2024 |
$1,388
|
| Apr 2024 |
$1,438
|
| Mar 2024 |
$1,438
|
| Feb 2024 |
$1,438
|
| Jan 2024 |
$1,438
|
Be informed and make custom offers based on median rent prices. However, keep in mind that the price may vary depending on the size and amenities of the apartments for rent.
Renter's FAQ About Torrington, CT
-
What types of properties are available for rent in Torrington, CT?
In Torrington, CT, you can find a variety of properties available for rent, including townhouses, apartments, houses, and condos.
-
What amenities are commonly included in rental properties in Torrington, CT?
Rental properties in Torrington, CT often come with amenities such as parking facilities, dishwashers, hardwood floors, roof decks, and air conditioning. However, the availability of specific amenities may vary depending on the property.
-
What is the walkability score of Torrington, CT?
Torrington, CT is a suburban community known for its walkable downtown area. While a specific walkability score might not be available, residents often find it convenient to access local amenities such as shops, restaurants, and parks on foot.
-
How is the rental market in Torrington, CT?
The rental market in Torrington, CT is dynamic, offering a blend of rental properties to suit different needs and budgets. It is advisable to stay updated on current market trends and availability by contacting local rental agencies or exploring online platforms like Rentberry's pricing statistics for Torrington, CT.
City Overview
The median household income in Torrington, CT is around $58,717, while the median age is 44.5. This city is a home to major universities: n/a, n/a, and n/a. 17,983 employees work in Torrington, CT. The homeownership rate among the residents is 66.76%. The median property value that you should keep in mind is $162,300.