Turlock, CA, USA apartments for rent

$11,610
$11,610
Available: Right Now
Welcome to our inviting 4-bed, 3-bath haven in the heart of Turlock, California—a perfect blend of stylish living, modern amenities, and a tranquil backyard oasis. From the moment you step inside, you'll discover a retreat designed for your utmost co...

$8,850
$8,850
Available: Right Now
You’re invited to stay in our home! Located in the heart of Turlock. Minutes from most popular fast food chains, restaurants, event halls, and stores. Our home is family friendly and perfect for larger groups. We have designed it with comfort and con...
$2,800
$2,800
Available: 24/06/2024
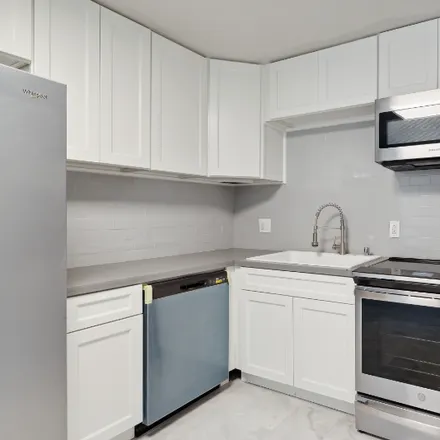
Built in 2023Corner lot location with excellent curb appealModern kitchen with white shaker cabinets and a spacious island with built-in sinkIncludes washing machine, dryer, and refrigeratorFour spacious be...

$12,600
$12,600
Available: Right Now
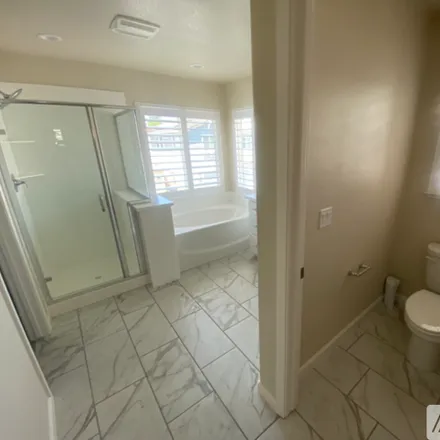
The whole group will enjoy easy access to everything from this centrally located place. This home was custom built with double doors and bigger bathrooms. All three bathrooms have showers which is a great plus. There are 6 beds along with 3 full size...

$6,000
$6,000
Available: Right Now
Welcome to our spacious family house with 4 bedrooms and 2 bathrooms! Nestled in a quiet neighborhood, this charming home is the perfect place for your family to relax and create unforgettable memories. As you step into our inviting living room, you'...
$1,950
$1,950
Available: Right Now
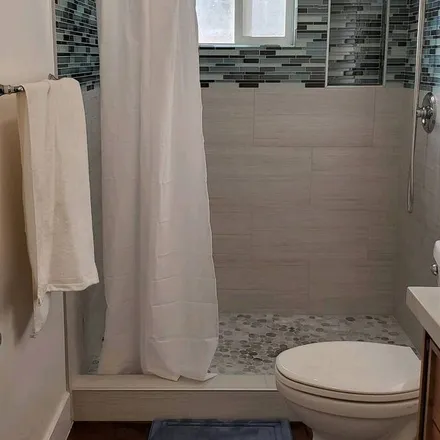
We accept Section 8 Stanislaus County Housing Voucher Tenants. Welcome to this newly remodeled house in turlock which boasts a brand new bathroom (wall to wall porcelain tile, modern fixtures rainfall shower), a newly remodeled kitchen (new cabinets,...

$3,600
$3,600
Available: Right Now
We put a lot of love into this place. We recently renovated with modern touches, a complete gourmet kitchen modern. It has everything you could need to cook your meals. Our new fireplace able to change fire colors it gives a warm and romantic feeling...
$2,699
$2,699
Available: 10/05/2024
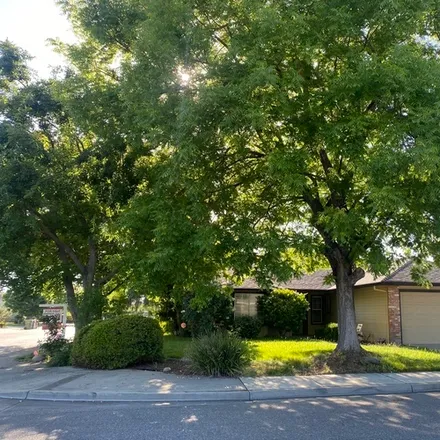
Very Spacious, Big and Beautiful home located in a very desirable neighborhood on a corner lot and in a lovely cul de sac. Steps away from the beautiful Markley park. Home has open floor plan which is great for entertaining. 3 bedrooms + 1 big ex...

$2,200
$2,200
Available: 01/05/2024
Live comfortable in this spacious home. It's conveniently located to everything Oakdale has to offer. New smoke free home built with all energy saving technologies. Front room (wired for TV surround sound), Big kitchen with lots of cabinet space and ...

$14,970
$14,970
Available: Right Now
Special offers by Host for the summer!! With large rooms and comfy beds this stylish place is perfect for group trips, company work crew stays of 10 or more, travel nurses, travel teams for school sporting events etc.All new furniture with beds too s...

$5,970
$5,970
Available: Right Now
You are invited to stay at our cozy home. Where you'll have many options for fast food chains, restaurants, and much needed retail therapy "sessions," and more, all within a 5 minute drive! Our Home has been furnished and supplied with you in mind. E...

$6,420
$6,420
Available: Right Now
The Heart of the Valley takes it's name after what the city of Turlock represents to the Central Valley, it's heart. I wanted to use this as inspiration to create a home the embodied this. I worked closely with local interior designer, Marísela Rodrí...

$4,020
$4,020
Available: Right Now
Discover the charm of Turlock while staying at this 2-bedroom, 1-bath vacation rental! With a fully equipped kitchen, a cozy living area, and a private backyard, this cottage offers a comfortable retreat for your getaway. Take a short walk to downtow...

$5,670
$5,670
Available: Right Now
Great home located in north central Turlock. This home has 2 bedrooms, 1 bathroom and walking distance to the hospital. Grocery stores, restaurants and parks are also within walking or biking distance. Home also has plenty of parking with 2 in front ...

$2,850
$2,850
Available: Right Now
Stay in our Cozy studio with a pillow top mattress with duvet that will give you a good night rest and comfortable sofa , high speed internet with Wi-Fi in unit is ready for you to use and our Smart TV is connected with a VUDU account with over 400 m...

$14,790
$14,790
Available: Right Now
A short distance from snowboarding, cross-country skiing, and more, this pet-friendly cabin lets you experience it all. Thanks to the convenient onsite parking, you can either leave your vehicle behind and let your feet make short work of the 13-m...

$5,160
$5,160
Available: Right Now
We are excited to host you in my updated apartment, one of my newest apartments. This recently updated single story apartment is located in Turlock Ca. Close to downtown, Highway 99 & Emanuel Hospital. We have updated this apartment with laminate flo...

$3,000
$3,000
Available: Right Now
This unique studio apartment boasts a private entrance and a stylish decor centered around a blue and beige theme. Comfort is priority, with features including a Sealy Posturepedic Plus-Queen Bed with built-in Climate Control and SealyCool Gel Memory...
$3,900
$3,900
Available: Right Now
We put a lot of love into this place. The place has a lot of natural lighting. The open kitchen and living room concept design will make you feel very free. The modern design will allow you to feel relaxed. Most lights at the place are dimmable. Allo...

$3,270
$3,270
Available: Right Now
At Casa Orozco #1, rest assured that your stay will be nothing short of amazing. With a stellar track record on various home rental platforms, we have established an outstanding reputation. Our hassle-free, contactless check-in process adds convenien...

$6,060
$6,060
Available: Right Now
Explore California’s Central Valley in style with a stay at this Turlock vacation rental! Sporting 4 bedrooms and 3 bathrooms, 2 separate living areas, and a spacious backyard, this home is perfect for families visiting the university or enjoying the...

$7,500
$7,500
Available: Right Now
4 bedroom, 2 bathroom, living room, family room, bonus room, laundry machines included. 2 queen air beds for additional guests. Full kitchen, patio with patio furniture and bbq. WiFi included with 2 smart TVs one in family room and one in bonus room....
Turlock
Turlock, CA has a population of 71,906, while the median age is 34. The household income in Turlock, CA is around $53,661. The homeownership rate among the residents is 52%. The median residential property value in Turlock, CA that you should keep in mind is $267,100.
| Population | 71,906 |
| Median Age | 34.4 |
| Poverty Rate | 16% |
| Household Income | $53,661 |
| Number Of Employees | 31,299 |
| Median Property Value | $267,100 |