Worcester, MA, USA apartments for rent
$2,300
$2,300
Available: Right Now
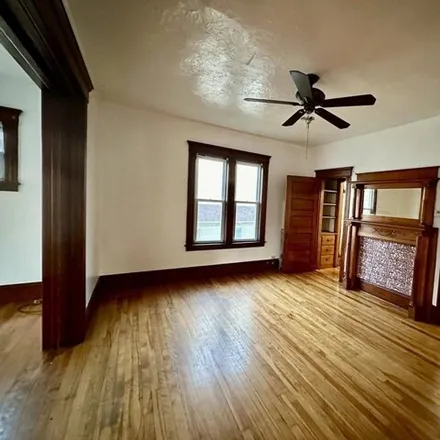
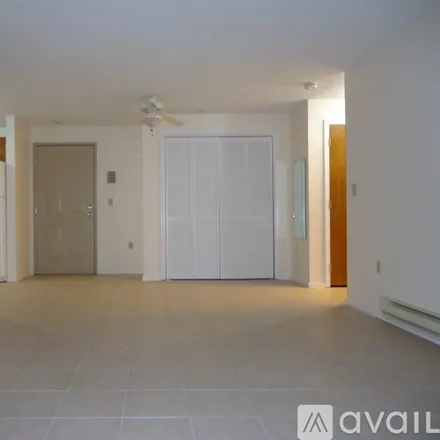
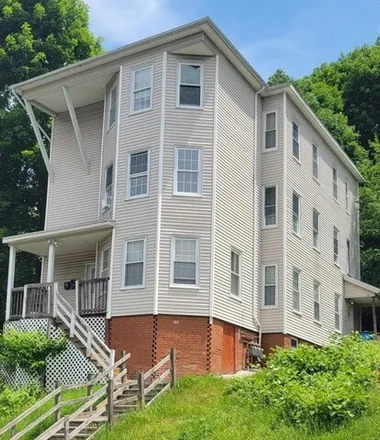
West side apartment, with over 1300 sq ft in a triple decker with many original features. It is on the 2nd floor and comprises 3 beds, 1 bath, an eat-in kitchen with a spacious pantry, along with a large living room and separate dining room with pock...

$1,625
$1,625
Available: Right Now
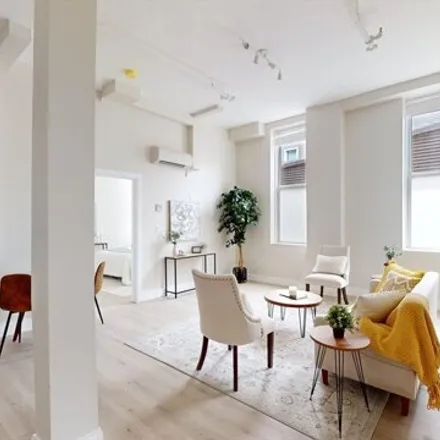
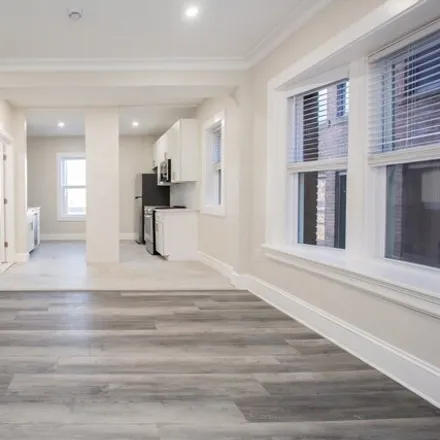
Gorgeous 3rd floor front facing corner Studio Loft in one of the most desirable and finest condominium buildings in Worcester. Featuring high ceilings, separated area for a Bedroom, massive windows with great views, polished concrete floors, modern k...
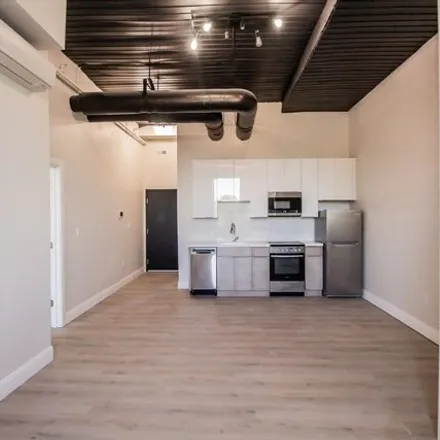
$3,125
$3,125
Available: Right Now
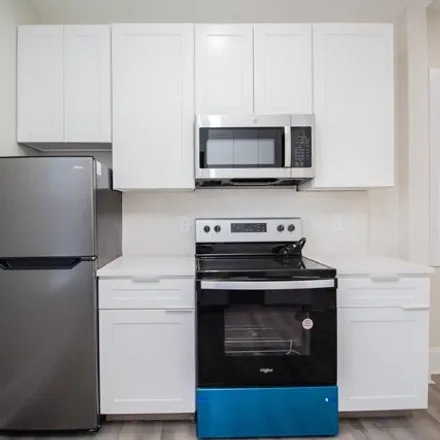
Newly renovated downtown Worcester 3 bedroom unit available. Enjoy the open concept with convenient access to the modern kitchen with stainless steel appliances. High efficiency heating/cooling (A/C) system in unit. Wonderful natural light in the bed...
$2,050
$2,050
Available: Right Now
Be the first to live in this sleek two-bedroom apartment situated in Worcester's bustling center. Enjoy an airy open-plan layout with high ceilings and large windows flooding the space with natural light. Modern kitchen featuring stainless steel appl...
$2,800
$2,800
Available: Right Now
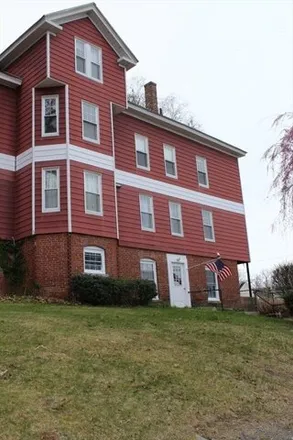
Welcome! Located at the end of a serene, dead-end street! This beautifully renovated property boasts three spacious bedrooms with the potential to easily convert a room for an additional bedroom or home office, offering versatility to suit your lifes...

$3,480
$3,480
Available: Right Now
This sleek condo consists of an open layout with a large welcoming living room, two bedrooms, and a kitchen complete with a new stainless steel appliance set, new quartz countertops, and new cabinets with underlighting. The bathroom comes fitted with...
$1,850
$1,850
Available: 01/07/2024
The property is within walking distance to St. Vincent's, UMASSand WPI. The area is quiet but with easy access to R290, union station, shopping centers and supermarkets. The unit is recently renovated with the two bedrooms on each side of the large l...
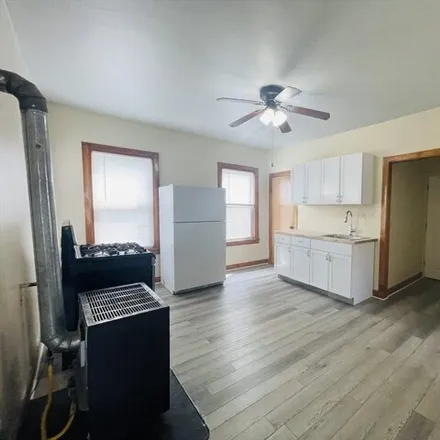
$1,700
$1,700
Available: Right Now
2 bedroom with newer appliances, refinished hardwoods and fresh paint throughout. New forced hot air heating system. Plenty of cabinet space, walk in pantry and laundry hookups. Located minutes to to downtown and great highway access. Landlord reques...

$1,750
$1,750
Available: 01/07/2024
Newly updated lead safe third floor two-bedroom apartment. New carpet in both bedrooms and living room. New granite counter tops in eat-in-kitchen. Large full bath including washer/dryer hookup. Minutes from Kelly Square, Polar Park, Route 290, Worce...
$1,900
$1,900
Available: Right Now
This cozy 3-bedroom apartment offers comfortable living at an affordable price. The spacious living room is perfect for relaxing with family or entertaining guests. The kitchen comes equipped with essential appliances and plenty of cabinet space for ...

$2,350
$2,350
Available: Right Now
Available for june 1st completely remodeled 1st floor apartment with 3-bedrooms. approximately 1200 square feet of living space, dead-end street overlooking indian lake. open concept floor plan. full kitchen with granite counter tops and oak cabin...

$933
$933
Available: Right Now
Hi there,I am looking for a roommate to share a beautiful half-duplex with me in the Vernon Hill area of Worcester. The rent is $ per month per room, and it's ideal for university students who need a place for the upcoming semester. Here are some...
$2,950
$2,950
Available: Right Now
Newly renovated downtown Worcester 3 bedroom unit available. Enjoy the open concept with convenient access to the modern kitchen with stainless steel appliances. High efficiency heating/cooling (A/C) system in unit. Wonderful natural light in the bed...
$2,380
$2,380
Available: Right Now
Modern One-Bedroom in the heart of Worcester - Be the first to live in this sleek one-bedroom apartment situated in Worcester's bustling center. Enjoy an airy open-plan layout with high ceilings and large windows flooding the space with natural light...

$2,000
$2,000
Available: Right Now
Gorgeous custom remodeled2BR 1 BAon the second floor with great views from the balcony. Laminate flooring throughout, newer cabinets, marble Countertops, modern LED lighting fixtures. Upgraded bathroom with sliding glass enclosure for the tub. 2 larg...
$3,000
$3,000
Available: Right Now
Beautifully maintained 1st floor 3 bedroom apartment steps from Worcester State University in the Tatnuck area of Worcester. Updated kitchen and bath. All hardwoods throughout with built ins and high ceilings. Large dining and living room with a func...
$2,000
$2,000
Available: Right Now
Renovated 3 bedroom 1 full bath 2nd floor unit available for rent in Worcester. Enjoy the lovely updated, eat in kitchen! Offering vinyl floors and a back porch, great for storage! Year long lease, first last and security deposit required for move in...
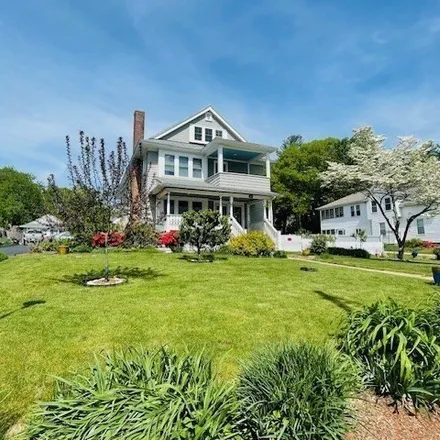
$3,000
$3,000
Available: Right Now
Opportunity to rent a beautiful single-family home! This charming residence features 3 spacious bedrooms, a generously sized full bathroom, a private backyard perfect for outdoor activities, and convenient off-street parking. The interior is freshly ...

$2,700
$2,700
Available: Right Now
Rent this spacious 3-bedroom, 1.5-bath home nestled in a serene neighborhood. Enjoy the convenience of a fenced backyard, a modern kitchen with marble countertops and island, updated appliances, and the cozy ambiance of a fireplace. Includes a 1-car ...

$1,800
$1,800
Available: Right Now
2 Bedroom, 1 bathroom available on the 3rd floor of a 3 unit building. Unit has 2 bedrooms plus office space, an eat-in kitchen with a pantry that has a dishwasher and the kitchen also has washer/dryer hookups (no machines provided). Good closet spac...

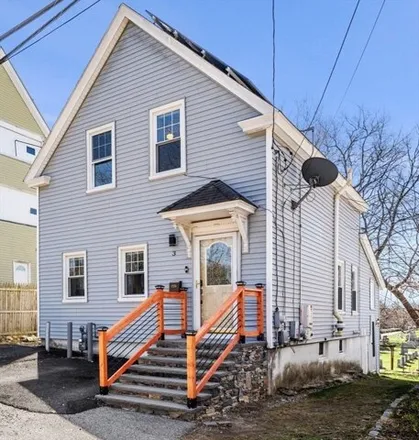
$3,000
$3,000
Available: Right Now
Welcome to your new home at 15 Ancona Rd in a charming area of Worcester!! Nestled in a prime location, this delightful rental offers the perfect blend of convenience and comfort. This home sits perched atop a hill and features 3 spacious bedrooms an...
$2,800
$2,800
Available: Right Now
Completely Reimagined Living in the Heart of Worcester! Luxurious Finishes! Open Concept Kitchen with Quartz Counters, Full Appliance Package in Stainless Steel, Center Island w pendant lighting, LVT Flooring through the main living arears and 4 Full...
Worcester
Worcester, MA has a population of 184,743, while the median age is 34. The household income in Worcester, MA is around $45,869. The homeownership rate among the residents is 42%. The median residential property value in Worcester, MA that you should keep in mind is $210,600.
| Population | 184,743 |
| Median Age | 34.2 |
| Poverty Rate | 22% |
| Household Income | $45,869 |
| Number Of Employees | 86,177 |
| Median Property Value | $210,600 |
What is the Average Rent for Worcester, MA Apartments?
The average rent for apartment in Worcester, MA: $3,251
(-23.8%)
| Month | Median Price |
|---|---|
| Jun 2024 |
$2,032
|
| May 2024 |
$2,134
|
| Apr 2024 |
$1,962
|
| Mar 2024 |
$1,962
|
| Feb 2024 |
$1,962
|
| Jan 2024 |
$1,962
|
| Month | Median Price |
|---|---|
| Jun 2024 |
$3,251
|
| May 2024 |
$4,266
|
| Apr 2024 |
$2,590
|
| Mar 2024 |
$2,590
|
| Feb 2024 |
$2,590
|
| Jan 2024 |
$2,590
|
Be informed and make custom offers based on median rent prices. However, keep in mind that the price may vary depending on the size and amenities of the apartments for rent.
Renter's FAQ About Worcester, MA
-
What types of properties are available for rent in Worcester?
Worcester offers a variety of rental options including apartments, houses, condos, rooms, and townhouses. You can choose based on your preferences and needs.
-
What amenities can I expect in rental properties in Worcester?
Rental properties in Worcester come with a range of amenities to suit different lifestyles. Some popular amenities include parking spaces, air conditioning, dishwashers, gardens, and hardwood floors. You can prioritize amenities based on your requirements.
-
What is the rental application process like in Worcester?
The rental application process typically involves submitting a completed application form along with supporting documents like identification, proof of income, and references. Landlords may also require a security deposit and the first month's rent. Once your application is reviewed and approved, you can sign the lease agreement and move in.
-
What are the most important factors to consider when renting in Worcester?
When renting in Worcester, important factors to consider include location, proximity to amenities such as schools and transportation, the condition of the property, lease terms, pet policies, and overall affordability. It's also essential to review the lease agreement thoroughly and understand your responsibilities and any restrictions before committing to a rental property.