East Orange, NJ, USA apartments for sale
$565,000
$565,000
Available: Right Now
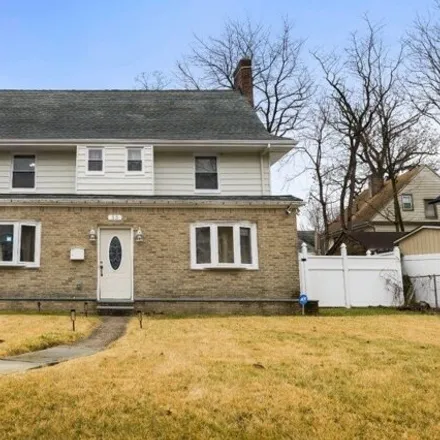
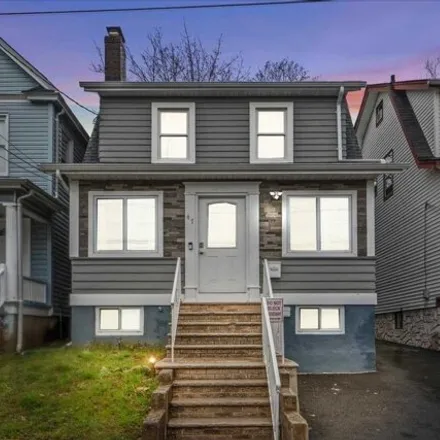
Presenting a captivating listing in East Orange?a meticulously designed 5-bedroom, 3.1-bathroom colonial residence boasting elegance and practicality. This charming property features spacious living areas, a well-appointed kitchen, and five great-siz...
$599,900
$599,900
Available: Right Now
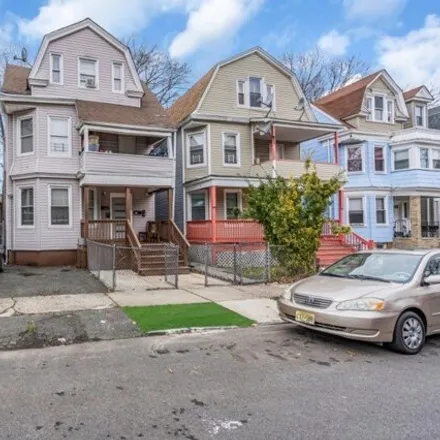
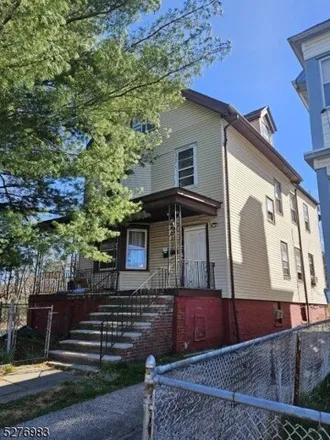
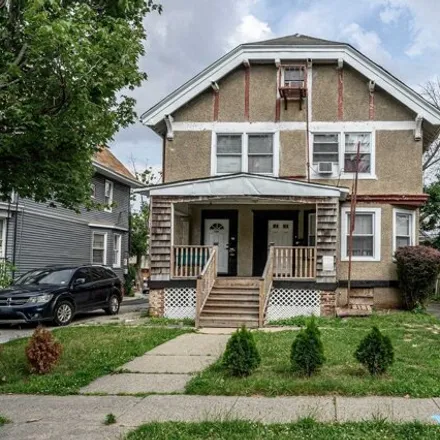
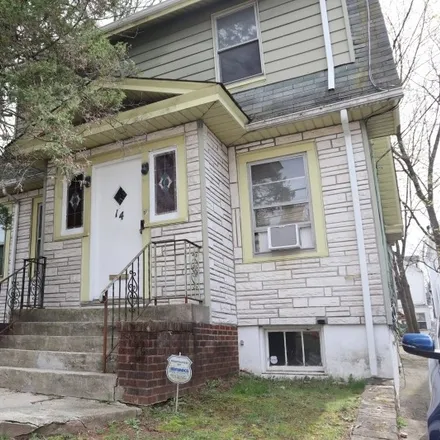
Amazing Investor opportunity for a fully occupied legal 2 family property! The property features a renovated First floor 2 bedroom/1 bath unit with large bonus room w/closet and front facing windows. 2nd floor features 3 generous sized bedrooms/1 bat...
$549,500
$549,500
Available: Right Now
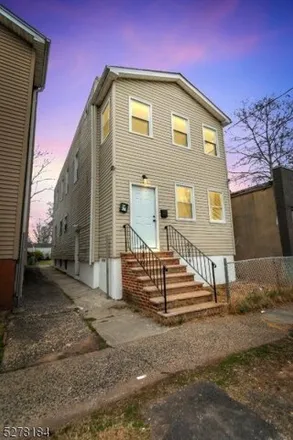
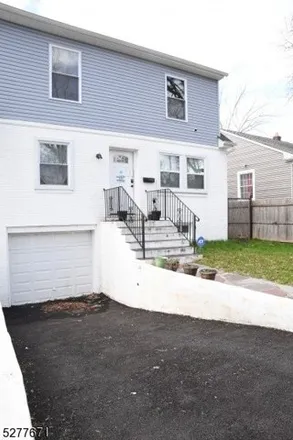
Welcome to your newly renovated 2 unit home in the heart of East Orange. Boasting with 4 bedrooms, 2 modern bathrooms with a large finished basement and a prime location. This property presents a rare investment opportunity for those seeking both com...
$550,000
$550,000
Available: Right Now
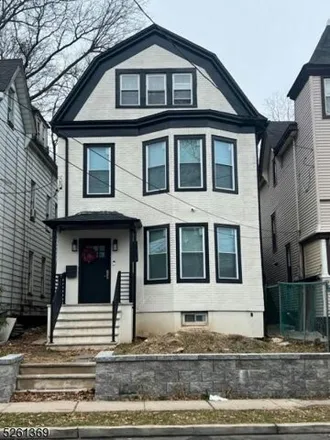
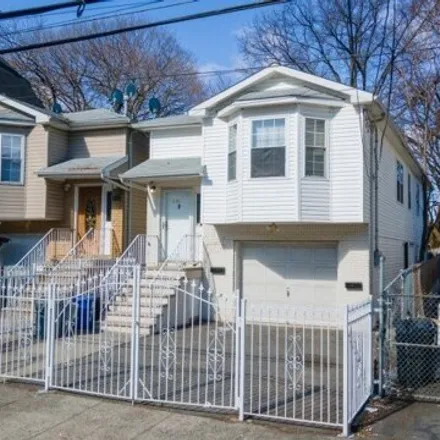
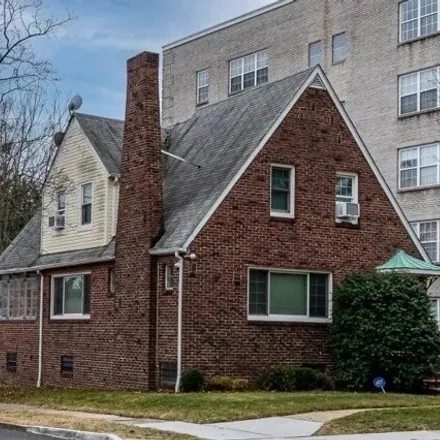
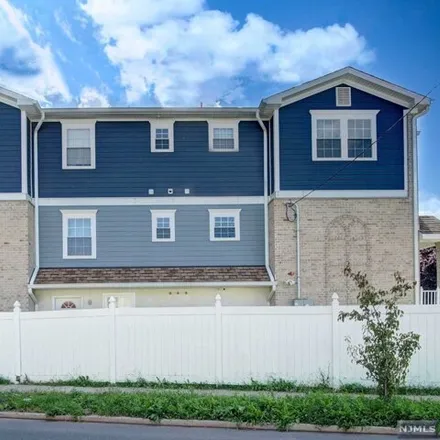
Completely updated brick house with newly installed anderson windows. walk into the large living room with high ceilings, open concept kitchen with custom cabinetry, pantry, quartz counter tops and Stainless steel appliances, dinning room w...
$435,000
$435,000
Available: Right Now
Here's your chance to restore this Charming Beauty and Execute Your Vision! This Home boasts 6-7 Bedrooms, 2.5 Baths with an upstairs Secondary On-Suite! In addition, there's a driveway, deck, and backyard! This Home is Perfect for many reasons! Clos...
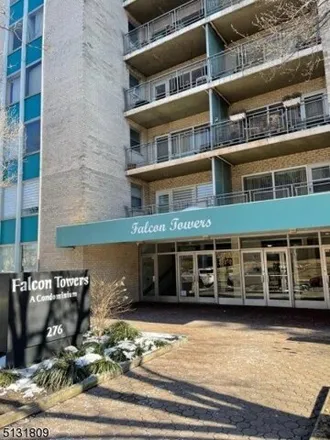
$185,000
$185,000
Available: Right Now
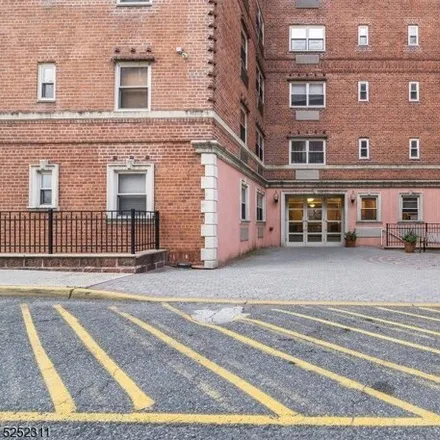
The Luxury Falcon Towers, a quiet community of well-maintained condominiums. We are offering an opportunity to purchase a most desirable and sought-after home. The home boasts a spacious 1 Bedroom and 1 Full Bathroom, Living Room/Dining Room combinat...
$519,900
$519,900
Available: Right Now
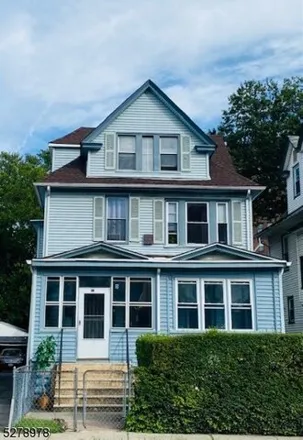
Extraordinary modernized and revitalized 5 bedroom 2 full bath oversized Colonial. True definition of expertise finishes throughout. A few interior complements are beautiful newer hardwood flooring throughout, new modern kitchen w/ stainless steel ap...
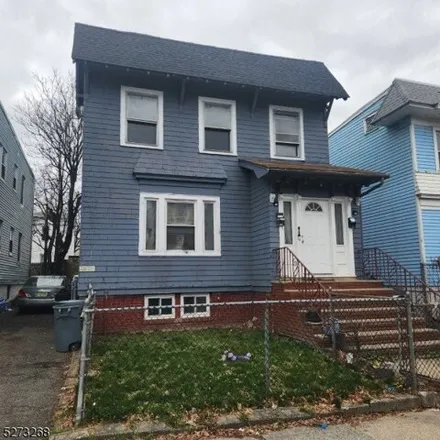
$425,000
$425,000
Available: Right Now
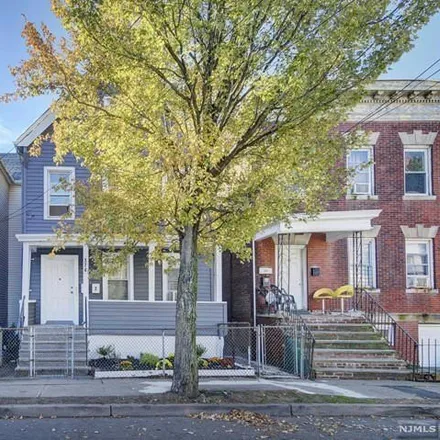
This 2-family home has hardwood floors, each apt has 1 bathroom, 2 bedrooms, a living room, a dining room, and a Kitchen and 2 New Boilers. 2nd fl is vacant, There is a full basement. Off-street parking for approximately 3 cars and a backyard. Locati...
$530,000
$530,000
Available: Right Now
Welcome home to this beautiful two family home in the Dodd Town section of East Orange. 1st and 2nd floor consists of Elk, 2 bed, 1 bath, living room and dining room. Full finished basement with 1 large bedroom, 1 full bath, storage unit and laundry ...
$225,000
$225,000
Available: Right Now
Do not miss this opportunity to own this spacious and renovated 1 bedroom 1 bath unit with 3 deeded parking spaces Providing extra income (1 garage + 2 exclusive outside spots), featuring hardwood floors throughout, marble counter tops, laundr...
$599,999
$599,999
Available: Right Now
Opportunity knocks! Turnkey light, bright and airy modern newer construction legal two family. Unit 1 is a ground level two bedroom apartment. Wide and spacious, the primary bedroom boasts double closets. Large living room/dining room combo round out...
$279,000
$279,000
Available: Right Now
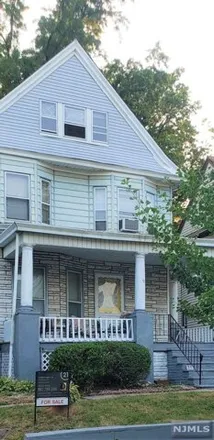
Classic 1930 Colonial in prime East Orange neighborhood, within close proximity to shopping, schools, houses of worship and transportation. This 5 bedroom beauty possess exceptional character throughout with high coffered ceilings, intimate enclaves,...
$576,000
$576,000
Available: Right Now
Nestled in a welcoming neighborhood, this charming one-family house boasts three spacious bedrooms and 2.5 baths, providing ample space for a growing family or anyone looking for a comfortable home. The house's exterior features a well-maintained law...
$550,000
$550,000
Available: Right Now
Spacious Two Family home in the heart of East Orange with 3rd Floor Bonus Unit is bursting with possibilities! An excellent investment property to add to your portfolio for easy extra income. Unit 1 offers 1 Bedroom, 1 Full Bath, a lovely Living rm w...
$570,000
$570,000
Available: Right Now
Located just two blocks away from the nj transit orange station in the heart of orange, nj. this renovated two-family home is a remarkable find. w/ a total of 6 bds, 3 bths, and 4 floors of living space, it ' S the perfect blend of c...
$750,000
$750,000
Available: Right Now
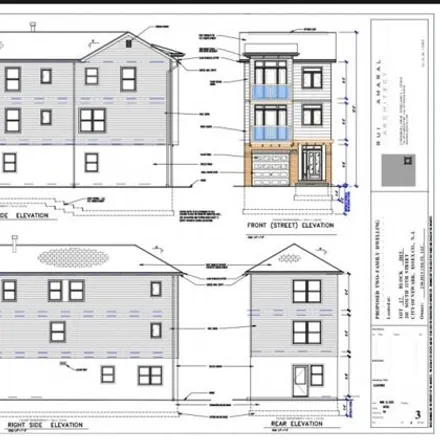
New construction opportunity with 5 year tax abatement! This to-be-built 2-family home boasts two spacious units, each featuring 3 bedrooms, 2 full bathrooms, in-unit laundry facilities, and a private balcony. Enjoy the convenience of a two car garag...
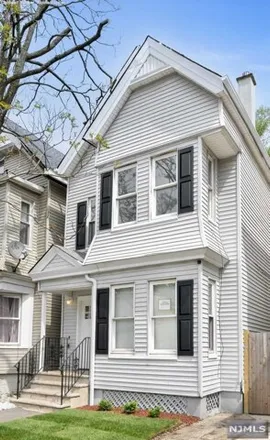
$429,900
$429,900
Available: Right Now
This home is situated in a quintessential tree lined street in the heart of the desirable Vailsburg section. Walking in through the enclosed sunporch you are welcomed by a large and inviting living room with a fireplace. The first floor has an open c...
$250,000
$250,000
Available: Right Now
$425,000
$425,000
Available: Right Now
Embrace a blend of comfort and modern living in this beautifully updated 4-bedroom, 2.5 bathroom home, complete with a finished basement that offers endless possibilities. From the moment you step inside, the warm embrace of natural light and open sp...
$950,000
$950,000
Available: Right Now
Embrace the Future of Urban Living in Our Spectacular Gigantic Newer Construction Triplex! Elevate your urban experience! This magnificent triplex is a testament to contemporary design and forward-thinking living. Our triplex is strategically positio...

$799,999
$799,999
Available: Right Now
Nestled in the prestigious heart of town, this stunning all brick colonial home stands as a testament to classic elegance and modern luxury. Fully renovated and boasting three levels of living space, this expansive residence offers the ultimate in co...
$370,000
$370,000
Available: Right Now
East Orange
According to statistics, the population in East Orange, NJ amounts to 65,151, which shows decline 1% compared to the previous year. The median age of the city’s residents is 37. The average household income is $41,819, shifting growth 9% from the past year, and the average property value in East Orange, NJ decline -2% to $205,100 throughout the year.
| Population | 65,151 |
| Median Age | 36.9 |
| Poverty Rate | 19% |
| Household Income | $41,819 |
| Number Of Employees | 29,551 |
| Median Property Value | $205,100 |
Household Income
The average household income in East Orange, NJ grew from $38,403 to $41,819 in the past year. This data is an estimate based upon 24,195 households in East Orange, NJ . The chart below presents how household income is distributed in East Orange, NJ in comparison to the revenue allocation amid households nationally.
Property Value
According to data from last year, the average property value in East Orange, NJ shifted from $209,500 to $205,100 throughout the year. The subsequent graph indicates the share of properties in the given price range in East Orange, NJ in comparison to the median property value in the same price segment across the country. According to the data, the greatest share of East Orange, NJ properties falls in the '$250,000 to $299,999' range, which is lower than the most significant median property across the country.
Rent vs. Own
Property Taxes
One of the most important aspects for property owners is the amount of property taxes. This graph shows distribution of property taxes in East Orange, NJ compared to median property taxes around the country. The prevalent amount of property taxes in East Orange, NJ equals $3000, which is less than the national average.