Irvine, CA, USA apartments for sale

$1,43M
$1,43M
Available: Right Now
Newly completely in 2020, all furniture is included, absolutely Turn-Key Condition. This sophisticated contemporary Single Family Home in Cadence Park which is a luxury master-planned community in Great Park, located within sight of the Cadence Park ...

$699,900
$699,900
Available: Right Now
This lovely condo offers Spectacular mountain views that will leave you breathless! Step into this well-loved and maintained home featuring 3 spacious bedrooms and 2 baths with a two-car attached garage. The moment you enter, you'll be greeted...

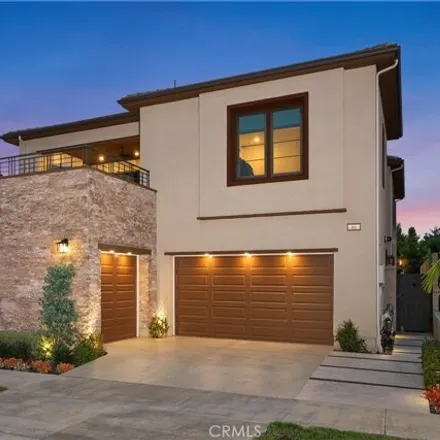
$1,5M
$1,5M
Available: Right Now
This remarkable property transports you to a bygone era of casual East Coast elegance. The design stands as a testament to the captivating appeal of New England's summer grandeur. The lush manicured lawn stretches down to the private lake just steps ...
$5,39M
$5,39M
Available: Right Now
Situated behind the grand gates of Irvine's prestigious, contemporary Altair neighborhood, discover 60 Bellatrix, - one of the most beautiful PRIME luxury Luminiere Collection resort homes on a Premium Lot! This ultra-spacious, contemporary6, 800 SFh...
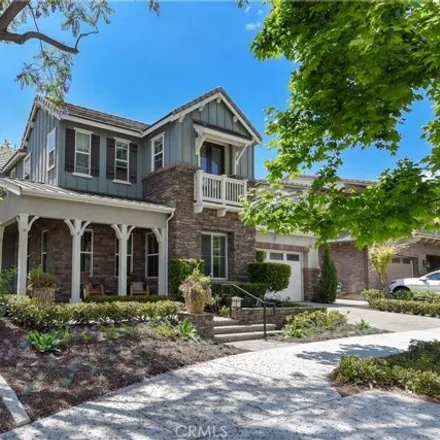
$3,46M
$3,46M
Available: Right Now
Formal Harmony Model Home 'Sonata', The Most Photographed Home in Pavilion Park Neighborhood. This Home had over$650, 000in Upgrades, and actually, too many Upgrades To List. 4-Bedroom plus Den Model Home Embodies Sophistication and Luxury. This Resi...

$1,3M
$1,3M
Available: Right Now
Welcome to this light-filled, inviting home in one of the best locations in the Stonegate Village community. Meander along the lushly landscaped walkway to this popular, rarely on the market, Plan 2 in the Santa Maria neighborhood. An expansive great...

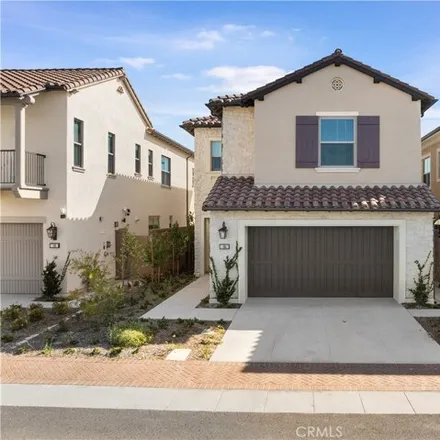
$3,67M
$3,67M
Available: Right Now
Welcome to this exquisite3286 SF 4-bedroom, 4.5-bathroom residence, with 10-high ceiling on main floor and 9-high ceiling on 2nd floor. Every bedroom boasts its own luxurious en-suite bath. Inside, the spacious living and dining areas are bathed in n...

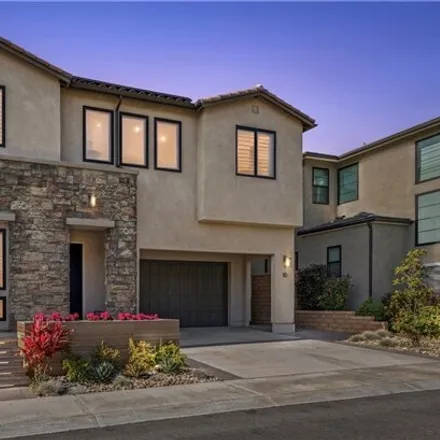
$2,99M
$2,99M
Available: Right Now
Exceptionally Rare Corner Lot Premium Single-Family Home with double master suites. This house features 5 bedroom 5 bath, 3 car garage. Highly upgraded house come with whole house wood flooring. nearly 6000 sqft corner lot brings lots of natural ligh...
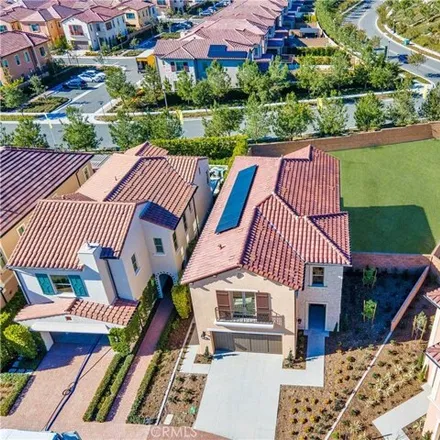
$3,1M
$3,1M
Available: Right Now
A brand new single family residence with unbeatable Canyon and Mountain View. This move in ready home fully upgraded at a cost of over 100K, extra large lot. Stunning 4 bedroom/4 bath home with loft. This Kitchen features with upgraded Counters and b...

$1,7M
$1,7M
Available: Right Now
Welcome home to this inviting architectural stunner located within the Woods community of Lake Forest. Settled in the trees at the end of a picturesque cul-de-sac, this home boasts one of the biggest parcels in the neighborhood. This Hearthside model...
$3M
$3M
Available: Right Now
With nearly$650, 000in Premium Upgrades and No mello roos, welcome home to 16 Alessio! This home is aPERFECT 5bedroom / 5 bath Residence in the quiet and private Teresina enclave built by Master Builder Shea Homes. This residence is nearly3, 8...

$1,19M
$1,19M
Available: Right Now
ThisTURNKEYVine Collection Residence 3 built by William Lyon Homes, features 2 beds, 2 baths with approximately1, 402square feet of living space with 2 car garage is Ready for its new owners. This Highly desirable single-level innovativ...

$4,44M
$4,44M
Available: Right Now
This Exclusive Estate is located in the 24-hour guard gated community of Tustin Ranch Estates. This impeccable 5121 square foot floorplan has dramatic high ceilings, 5 bedrooms with on suite private bathrooms, An Entertainment/Theatre wing and 5 car ...

$1,75M
$1,75M
Available: Right Now
Beautiful home in the Petaluma neighborhood of Eastwood Village. Beautiful 3 bedrooms and 2.5 bathrooms, large yard. The open kitchen features granite counters, vented cooking exhaust, microwave, professional gas cooktop and convection oven. Washer a...
$3,5M
$3,5M
Available: Right Now
Biggest lot new home at irvine ! Lot size up to 10500 sqft !Build your dream home at your backyard.Fabulous 4 Bedroom/4 bath Tuscan style home with loft, sitting high on the hills of Portola Springs. This wonderful home features a gourm...

$475,000
$475,000
Available: Right Now
Some bedrooms currently rented. This can be agreat investment... 2 story home in a gated community. Charming entryway to a private front patio before accessing this beautiful home offering a warmth and refined living. Spacious living room with high c...

$1,5M
$1,5M
Available: Right Now
This stunning residence is nestled in the heart of the brand new Rise Park by Lennar, a vibrant addition to the highly sought-after Great Park neighborhood. The home boasts a thoughtfully designed floor plan with 3 bedrooms, 3 full baths, and a 2-car...

$1,3M
$1,3M
Available: Right Now
Welcome to a floor plan that captivates many families, whether you're planning to make it your home or a profitable rental investment! As you enter the main door on the first floor, immediately to your right is a private bedroom suite complete with a...

$2,3M
$2,3M
Available: Right Now
Located at the quiet end of a cul-de-sac in the highly desired Northwood community, 11 Burke presents a rare opportunity to own a truly exceptional property that has an abundance of natural light though the five bedrooms, 3 full baths, and bonus room...

$7,7M
$7,7M
Available: Right Now
NEW custom construction in 2023 and being sold partially furnished! Situated within the coveted Harbor View homes affectionately known as the Port Streets. This custom inner loop residence epitomizes luxury living at its finest. Boasting meticulous c...

$1,76M
$1,76M
Available: Right Now
Discover your dream home at 14661 Alder Ln, Tustin, CA92780! The area of the original house is2544 SQFT,now300 SQFThas been added with permit.The actual area is2844 SQFT.The whole house has been remodeled. In its original condition but well cared for...
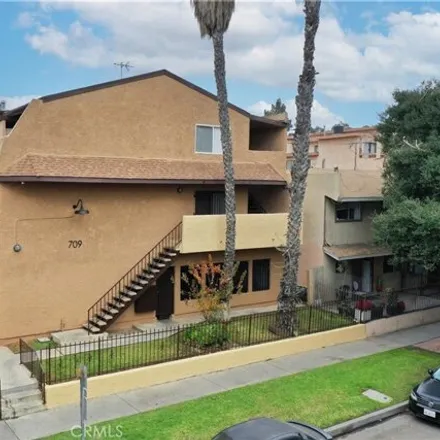
$3,48M
$3,48M
Available: Right Now
Pleased to present 709 East Chestnut Avenue, an immaculate turn-key 12-unit apartment building. Built in 1983 and nestled in the heart of Santa Ana, just minutes away from the Historical Downtown District, this property stands as one of the most attr...
Irvine
According to statistics, the population in Irvine, CA amounts to 256,877, which shows growth 4% compared to the previous year. The median age of the city’s residents is 34. The average household income is $95,573, shifting growth 2% from the past year, and the average property value in Irvine, CA growth 5% to $753,400 throughout the year.
| Population | 256,877 |
| Median Age | 34.4 |
| Poverty Rate | 13% |
| Household Income | $95,573 |
| Number Of Employees | 124,407 |
| Median Property Value | $753,400 |
What is the Average Price of Apartments for Sale in Irvine, CA?
| Month | Median Price |
|---|---|
| Jun 2024 |
$732,990
|
| May 2024 |
$711,891
|
| Apr 2024 |
$763,925
|
| Mar 2024 |
$763,925
|
| Feb 2024 |
$763,925
|
| Jan 2024 |
$763,925
|
| Month | Median Price |
|---|---|
| Jun 2024 |
$2,372,368
|
| May 2024 |
$2,007,612
|
| Apr 2024 |
$2,223,090
|
| Mar 2024 |
$2,006,369
|
| Feb 2024 |
$2,006,369
|
| Jan 2024 |
$2,006,369
|
Household Income
The average household income in Irvine, CA grew from $93,823 to $95,573 in the past year. This data is an estimate based upon 92,869 households in Irvine, CA . The chart below presents how household income is distributed in Irvine, CA in comparison to the revenue allocation amid households nationally.
Property Value
According to data from last year, the average property value in Irvine, CA shifted from $718,800 to $753,400 throughout the year. The subsequent graph indicates the share of properties in the given price range in Irvine, CA in comparison to the median property value in the same price segment across the country. According to the data, the greatest share of Irvine, CA properties falls in the '$500,000 to $749,999' range, which is higher than the most significant median property across the country.
Rent vs. Own
Property Taxes
One of the most important aspects for property owners is the amount of property taxes. This graph shows distribution of property taxes in Irvine, CA compared to median property taxes around the country. The prevalent amount of property taxes in Irvine, CA equals $3000, which is less than the national average.