Newport Beach, CA, USA apartments for sale
$2,49M
$2,49M
Available: Right Now
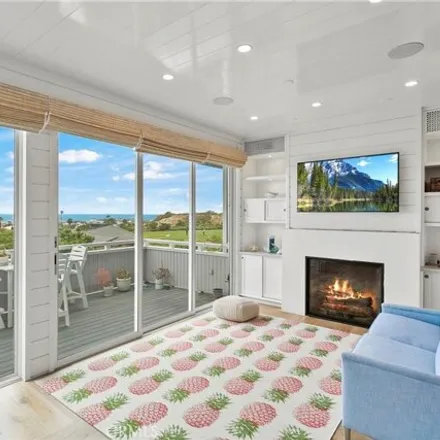
Welcome to your dream home in Newport Beach! This extensively remodeled condo is a true gem nestled in the heart of this coastal paradise. Boasting an elevated position atop the bluff, it offers breathtaking panoramic views of the ocean and Catalina ...

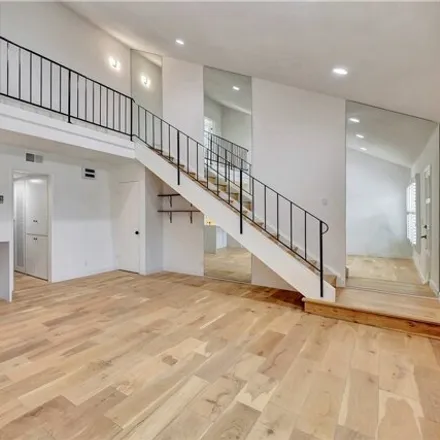
$1,43M
$1,43M
Available: Right Now
Welcome to2101 E15th St in Newport Beach, CA.! Upon entering, you will be greeted with floor to ceiling windows, skylights, and high ceilings, providing an abundance of natural light in this spacious, three bedroom, 2.5 bathroom townhouse. Featuring ...

$26,9M
$26,9M
Available: Right Now
1409 Dolphin Terrace the epitome of coastal luxury living in the prestigious Irvine Terrace neighborhood. This immaculate home has undergone a complete transformation, offering unparalleled sophistication and breathtaking views from almost every corn...
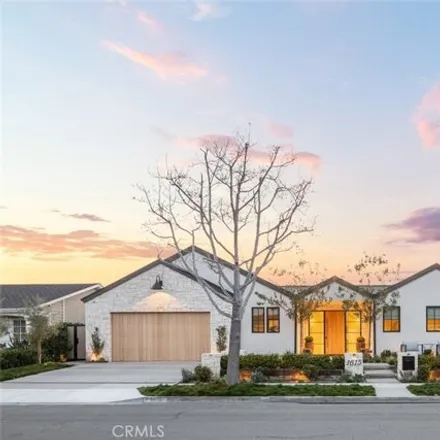
$4,18M
$4,18M
Available: Right Now
Location , Location , Location!! If you are looking for that perfect Newport Beach Peninsula home look no further, Currently the best priced turnkey Peninsula property!! The home was completely renovated in 2023 and has not been lived in or rented, T...

$3,3M
$3,3M
Available: Right Now
Ready to experience the very essence of Newport Beach living? 112 24th Street is a pristine beach bungalow ideally located a stone's throw away from Newport's sand. Charming from the curb, the front porch welcomes you with a peaceful space to sit and...
$2,7M
$2,7M
Available: Right Now
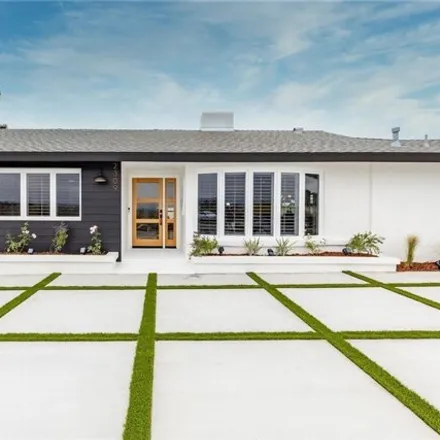
Seller willing to contribute to buyer permanent buydown with approved lender. Welcome to the newly remodeled 2309 Irvine Avenue, a stunning transformation in the heart of prestigious Newport Beach, CA. This exquisite property now blends contemporary ...
$5,95M
$5,95M
Available: Right Now
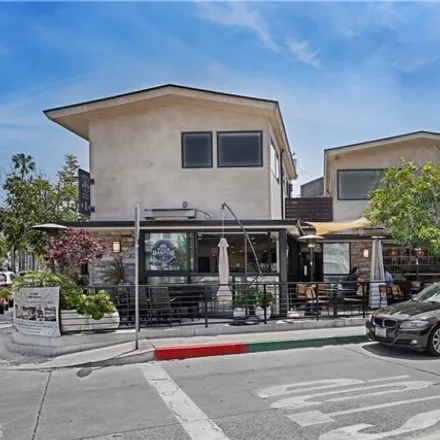
The property: Welcome to your slice of paradise on Balboa Island in Newport Beach! This exquisite property offers an unparalleled opportunity to own a top-performing restaurant with two stunning apartments above, all completely rebuilt to perf...

$2M
$2M
Available: Right Now
Welcome to Your Dream Home! Nestled in the highly sought-after Eastside Costa Mesa neighborhood, this beautifully remodeled 3-bedroom, 3-bathroom residence seamlessly blends modern amenities with classic charm, offering stunning views of the Santa An...

$4,6M
$4,6M
Available: Right Now
This single-level residence located in the exclusive enclave of Irvine Terrace, offers an inviting and spacious layout, complemented by numerous upgrades and timeless mid-century modern-inspired style. Welcomed by a private courtyard, the home featur...
$6M
$6M
Available: Right Now
Nestled on one of Dover Shores' premier streets, 1615 Lincoln offers an unparalleled residential experience that embodies timeless architecture and design. This newly constructed masterpiece, seamlessly blends comfort, luxury, serenity, and creativit...

$6,5M
$6,5M
Available: Right Now
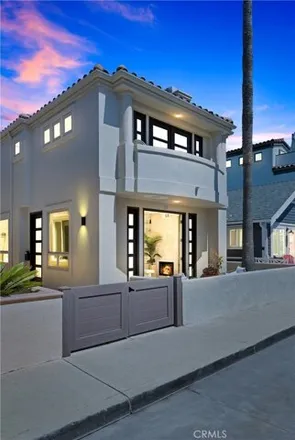
Discover your coastal sanctuary in this captivating modern masterpiece, mere steps away from the rejuvenating beach and bay. Meticulously designed with a blend of luxury and functionality, this recently built 4 bedroom, 4.5 bath home boasts exquisite...
$949,000
$949,000
Available: Right Now
Modern and stylish, welcome to the newly remodeled 152 Yorktown. Enter the 2 bedrooms / 2 baths with only one shared wall. Expensive European white oak wood floor throughout the whole house. Both bathrooms have new frameless glass shower doors, quart...
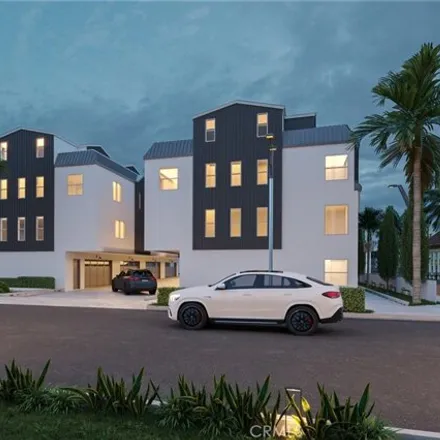
$2M
$2M
Available: Right Now
Estimated completion and occupancy april 2024. Welcome to Back Bay Townhomes, Newport Beach's newest and most enviable new address for those who seek chic living close to high-end shopping, great restaurants and postcard-perfect beaches. Limit...

$4,62M
$4,62M
Available: Right Now
383 West Wilson Street is a 12-unit multifamily investment property located in Costa Mesa, California. The property offers a mix of 10, one-bedroom units and 2, two-bedroom units. All units have undergone substantial renovations that include fresh pa...

$1,1M
$1,1M
Available: Right Now
Bring your toolbox and pickup truck, youll need it for this HB fixer with a ton of potential! This single-level 3-bedroom, 2-bathroom detached single family home is a fantastic opportunity for those looking to remodel their way to a dream home. Featu...

$4M
$4M
Available: Right Now
Located on one of the quietest streets on the Peninsula, this 44' wide lot offers an exceptional opportunity to craft your dream beachside retreat. Just moments from the beach, Newport Harbor Yacht Club, and the lively Balboa Pier and Fun Zone, this ...
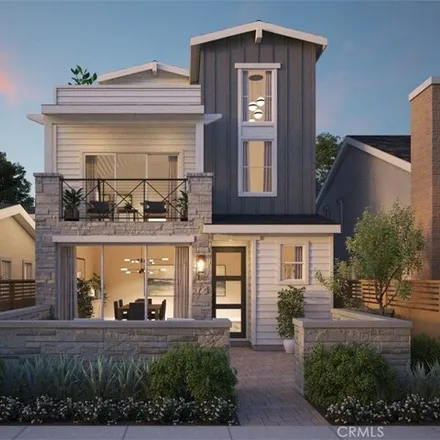
$3,6M
$3,6M
Available: Right Now
Indulge in the epitome of luxury living in this soon-to-be-finished property by Thomas James Homes, offering mesmerizing panoramic ocean views! Situated in the prestigious and sun-drenched enclave of Corona del Mar, close to the villages many shops, ...

$7,7M
$7,7M
Available: Right Now
NEW custom construction in 2023 and being sold partially furnished! Situated within the coveted Harbor View homes affectionately known as the Port Streets. This custom inner loop residence epitomizes luxury living at its finest. Boasting meticulous c...

$595,000
$595,000
Available: Right Now
Beautiful manufactured home built in 2020! Bayside Village Mobile Home Park in Newport Beach is close to the bay, private beach and marina, 2 clubhouses, 2 pools and short walk to Newport Dunes and back bay, a little over a mile to Balboa Island, jus...

$1,25M
$1,25M
Available: Right Now
Welcome to this Beautiful Newly remodeled Townhouse nestled in Irvines hidden gem community of Rancho San Joaquin! This rarely available San Carlos (Model E) floor plan offers unique features that set it apart. As you approach The Town house you will...

$10M
$10M
Available: Right Now
1529 Dolphin Terrace offers a rare opportunity to indulge in stunning, panoramic views of the Newport Harbor entrance, bay, Catalina, and the endless expanse of the ocean beyond. Located on the coveted front row of Irvine Terrace, this 4-bedroom, 3-b...

$8M
$8M
Available: Right Now
Enjoy panoramic ocean and Catalina views from this beautiful and spacious 3 bedroom, 2.5 bath single-story home in Corona del Mar. Multiple living areas, 3 fireplaces, and custom built-ins throughout. Newly remodeled and meticulously maintained, this...
Newport Beach
According to statistics, the population in Newport Beach, CA amounts to 86,793, which shows decline 0% compared to the previous year. The median age of the city’s residents is 47. The average household income is $119,379, shifting growth 3% from the past year, and the average property value in Newport Beach, CA growth 7% to $1,695,700 throughout the year.
| Population | 86,793 |
| Median Age | 46.7 |
| Poverty Rate | 6% |
| Household Income | $119,379 |
| Number Of Employees | 43,305 |
| Median Property Value | $1,695,700 |
What is the Average Price of Apartments for Sale in Newport Beach, CA?
The average sale price for apartment in Newport Beach, CA: $4,143,300
(+165.6%)
| Month | Median Price |
|---|---|
| Jun 2024 |
$4,143,300
|
| May 2024 |
$1,559,992
|
| Apr 2024 |
$1,819,376
|
| Mar 2024 |
$1,819,376
|
| Feb 2024 |
$1,819,376
|
| Jan 2024 |
$1,819,376
|
| Month | Median Price |
|---|---|
| Jun 2024 |
$4,143,300
|
| May 2024 |
$1,559,992
|
| Apr 2024 |
$1,819,376
|
| Mar 2024 |
$1,819,376
|
| Feb 2024 |
$1,819,376
|
| Jan 2024 |
$1,819,376
|
Household Income
The average household income in Newport Beach, CA grew from $115,845 to $119,379 in the past year. This data is an estimate based upon 37,971 households in Newport Beach, CA . The chart below presents how household income is distributed in Newport Beach, CA in comparison to the revenue allocation amid households nationally.
Property Value
According to data from last year, the average property value in Newport Beach, CA shifted from $1,584,900 to $1,695,700 throughout the year. The subsequent graph indicates the share of properties in the given price range in Newport Beach, CA in comparison to the median property value in the same price segment across the country. According to the data, the greatest share of Newport Beach, CA properties falls in the '$2,000,000 or More' range, which is lower than the most significant median property across the country.
Rent vs. Own
Property Taxes
One of the most important aspects for property owners is the amount of property taxes. This graph shows distribution of property taxes in Newport Beach, CA compared to median property taxes around the country. The prevalent amount of property taxes in Newport Beach, CA equals $3000, which is less than the national average.