Kansas City, MO, USA apartments for sale
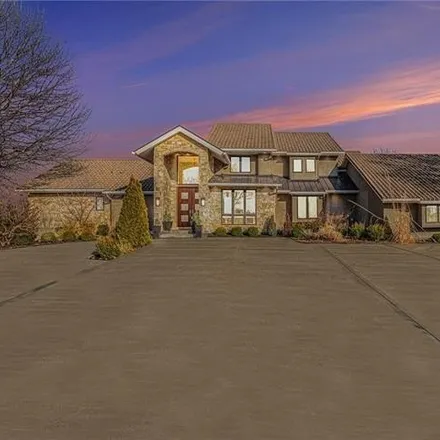
$3,18M
$3,18M
Available: Right Now
Welcome to resort style living with this Outstanding 9 bed/9 bath private estate that includes 3.89 tree lined acres, an exquisite saltwater pool, tennis court, outdoor kitchen, firepits, and mother in law's quarters! This beautiful property c...
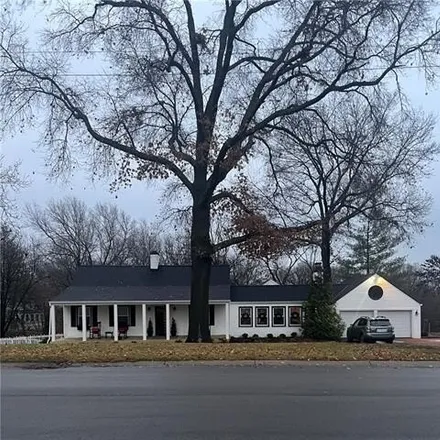
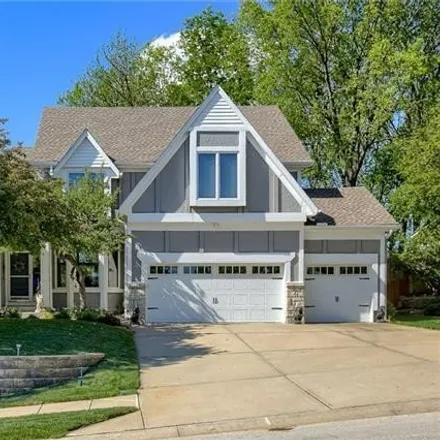
$750,000
$750,000
Available: Right Now
[ Create the life you ' Ve imagined .] A classic and Timeless home on just short of a full acre (.91). Sublime location nestled in Liberty's Blueberry Hills--mature landscape, and A 720sqft Carriage house. Many of t...
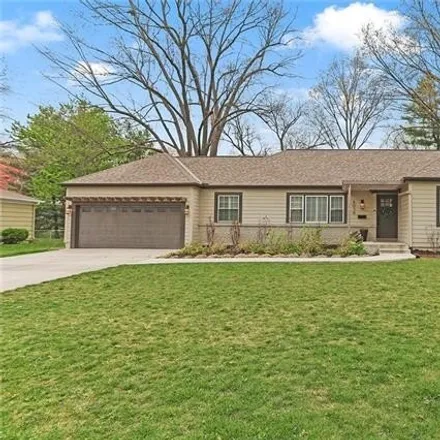
$750,000
$750,000
Available: Right Now
Absolutely stunning ranch home in highly desired Empire Estates with all NEW everything as of 2020! The light, bright, sophisticated color palette is accented with stunning touches of texture and detail to create a truly unique space that you won't b...
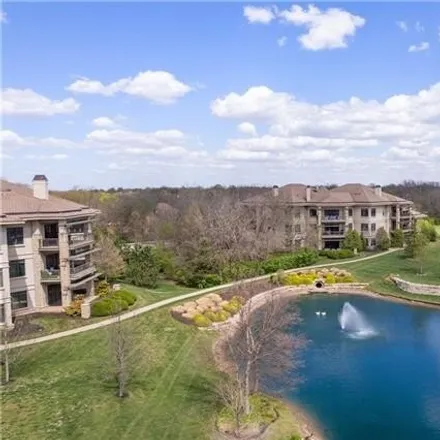
$775,000
$775,000
Available: Right Now
Welcome to luxury living at its finest in Leawood's Parkway 133 community. This stunning first-floor condo unit boasts a newly remodeled open concept design that includes new carpet, paint and light fixtures. Step into the elegant kitchen, where a la...
$249,000
$249,000
Available: Right Now
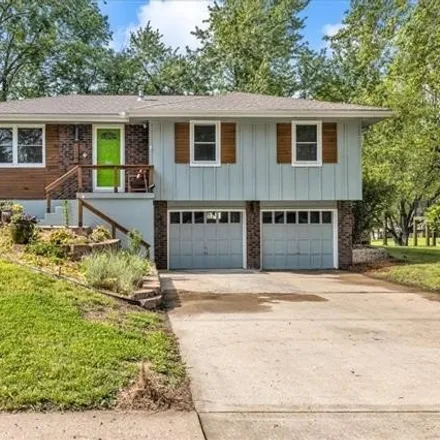
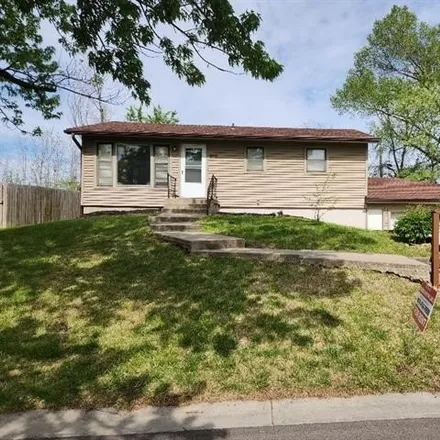
Welcome home to this adorable raised ranch in Liberty! Walk in the entry and immediately enjoy the brand new flooring throughout as you flow into the living room, which opens to the breakfast nook and kitchen. So much to LOVE about this space. Enjoy ...
$1,8M
$1,8M
Available: Right Now
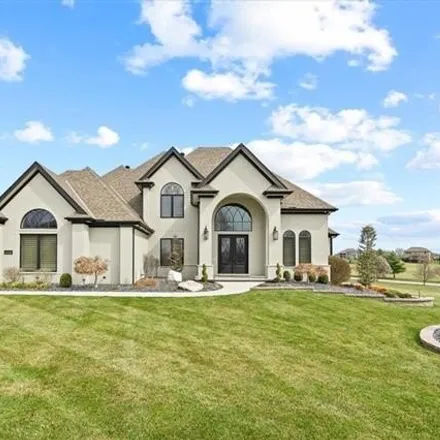
Welcome to your dream home at11750 NW81st St! This Immaculate property is more than just a house - it's a masterpiece of modern luxury and meticulous attention to detail. Boasting over 8700 sq ft of living space, every corner of this home has ...
$749,950
$749,950
Available: Right Now
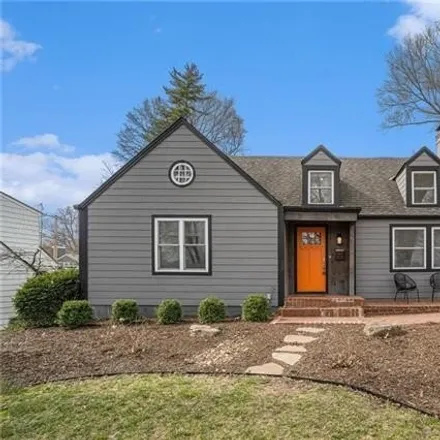
The allure is strong with this one! A charming and updated cape cod residing in the exclusive Golden Triangle with Mission Hills Country Club and Golf Course across the street. Timeless hardwoods and a natural flow from the front living room with fir...
$675,000
$675,000
Available: Right Now
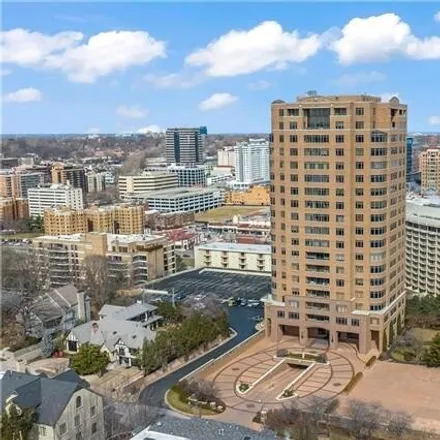
Live on the Plaza in time for The Plaza Lights! This Premiere Luxury Address awaits you in the Iconic Alameda Towers. This beautiful 3rd floor unit is one of only a few having 3 bedrooms, 3 full baths and a balcony facing The Plaza. Bright and open f...
$275,000
$275,000
Available: Right Now
Welcome to your dream home in Liberty, Missouri, where comfort, convenience, and community converge. This charming residence boasts a spacious layout featuring 3 bedrooms, 2 bathrooms, and a coveted 2-car garage, offering ample space for both relaxat...
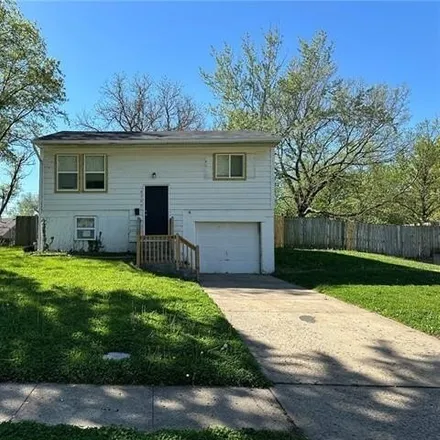
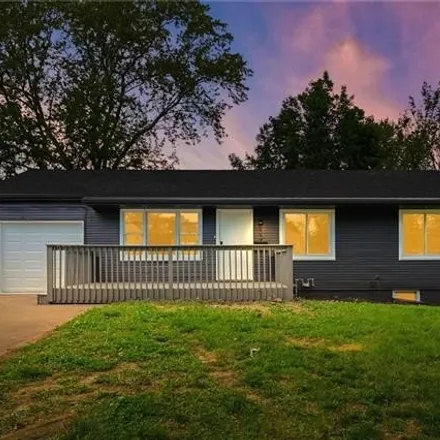
$175,000
$175,000
Available: Right Now
Step into this freshly renovated home, poised for your unique style and personalization. With a spacious floor plan, this residence offers three sizable bedrooms and two expansive bathrooms, providing ample room for your lifestyle needs. This listing...
$205,000
$205,000
Available: Right Now
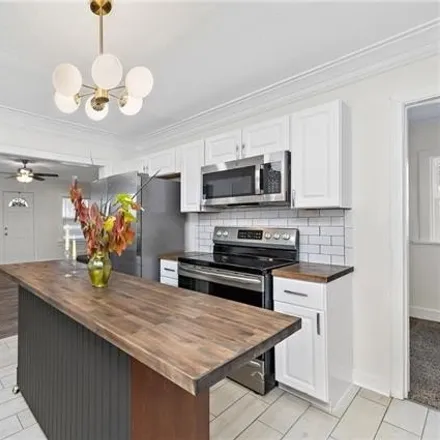
Stunning Newly Remodeled Home with Modern Upgrades! Welcome to your dream home! This beautifully remodeled residence offers a perfect blend of modern elegance and comfort. Situated in an established neighborhood. This property boasts a wealth of top-...
$175,000
$175,000
Available: Right Now
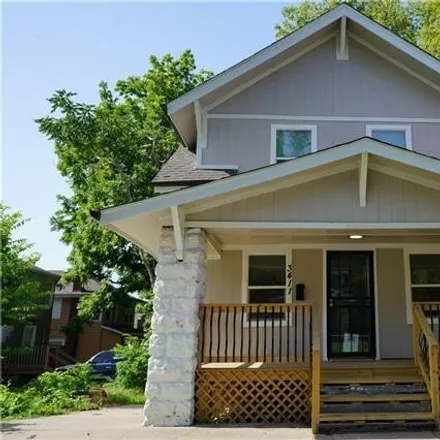
Welcome to a wonderful, charming bungalow home that's been well loved! Newer updates such as the HVAC system, HWH, Roof, Deck floor, interior paint, epoxy kitchen counter tops, carpet and main bathtub tile. A beautiful fireplace with bookshelves in t...
$675,000
$675,000
Available: Right Now
Incredible opportunity to own your own private oasis. Fabulous Curb appeal with new Hardscape and Rock Walls in the front, side and back of the house. Large lot filled with trees, extensive landscape - annuals and perennials. Gorgeous Swimming Pool j...
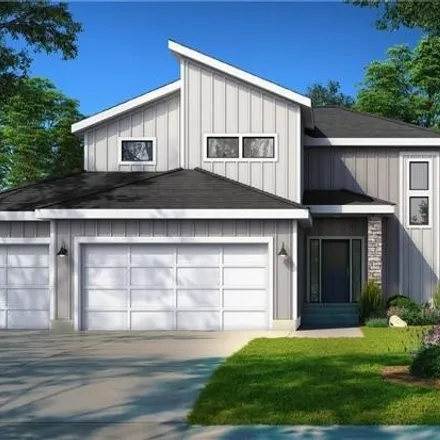
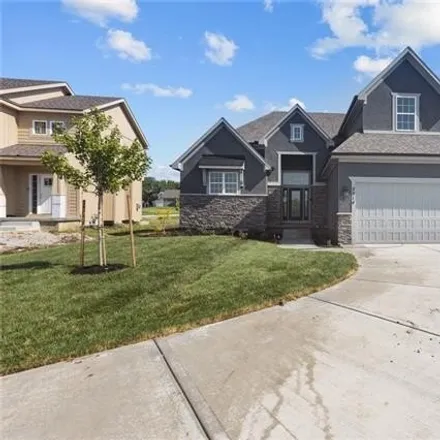
$466,295
$466,295
Available: Right Now
Welcome to Devotion, where comfort and style converge in this stunning 4-bedroom, 3.5-bath 2-story floorplan. This home features our Modern elevation, deck and lower level finish with daylight window package. Immerse yourself in the spacious primary ...
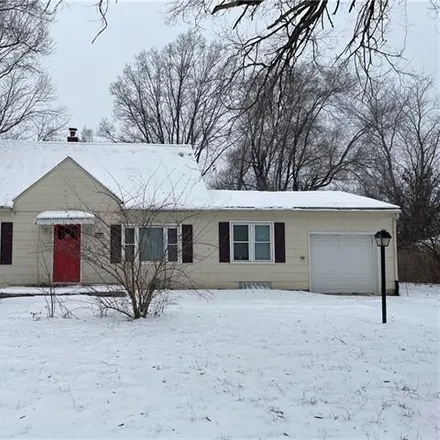
$175,000
$175,000
Available: Right Now
Welcome to your cozy retreat! Nestled in a peaceful neighborhood, this charming home offers a perfect blend of comfort and convenience. Step inside to discover a bright and airy living space adorned with soothing neutral colors, creating a serene atm...
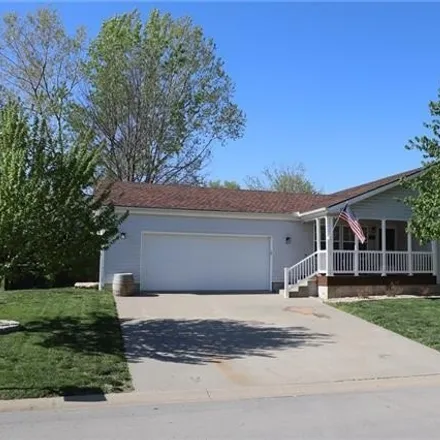
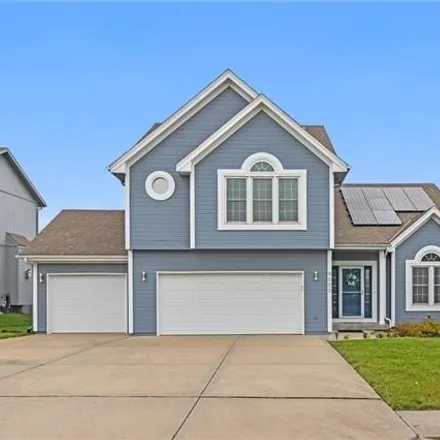
$299,950
$299,950
Available: Right Now
Better than new. This Maintenace free home has a lot to offer from the HOA mowing your yard in addition to snow removal. True ranch style home with everything brand new 3 years ago. The design/decoration of this home is very sharp from the colors, wo...
$200,000
$200,000
Available: Right Now
A charming updated home on a great sized lot. Sit out back in the sun room either listening to the rain pitter patter on the roof or enjoy the sunshine beaming in. Fresh paint inside and out this home is move in ready. Walk into the main living space...
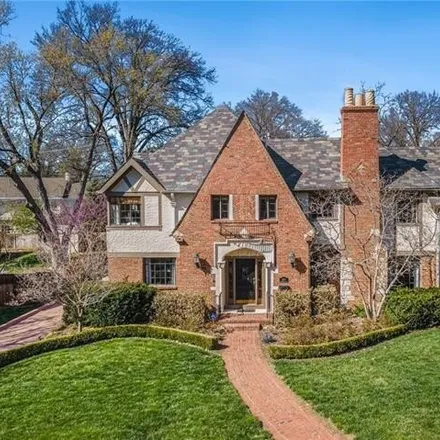
$1,3M
$1,3M
Available: Right Now
This Charming 4 bed/3 1/2 bath Tudor is perfectly placed on one of Kansas City's most coveted streets! Two master suites (one on main level and one on 2nd level), tons of character, large rooms, 10 ft ceilings and additions by sellers make thi...
$415,000
$415,000
Available: Right Now
Step inside and tour this clean and inviting 4 bedroom, 3 bath home in the popular Somerbrook subdivision within the Liberty School District! Seller says it's The Best Street in the Neighborhood. With 4 bedrooms theres plenty of space here! This home...
$599,900
$599,900
Available: Right Now
Quick close Available!The gorgeous Timberland by New Mark Homes is a lovely move in Ready 1 1/2 story home. It is featuring numerous upgrades such as 5 burner GE gas cooktop, 96 tall kitchen cabinets, full view linen glass front door, and seven zone ...
$219,000
$219,000
Available: Right Now
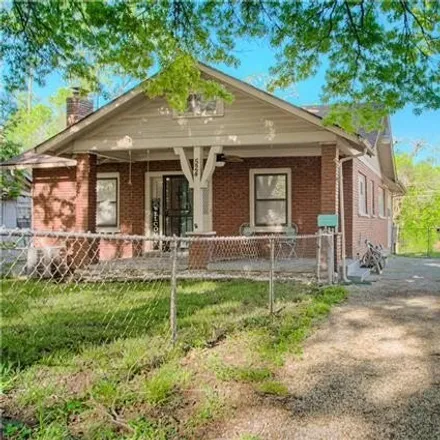
Come make this adorable 1950s home back into the gem it once was! This home is located on nearly 1 acre, close to the city, but has a country feel! Easily turn this two bedroom into a four bedroom by utilizing the mostly finished attic and the back a...
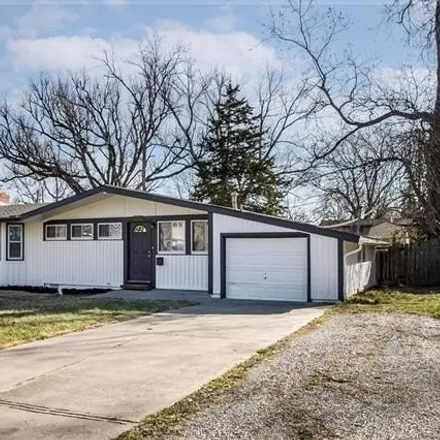
$215,000
$215,000
Available: Right Now
This adorable ranch just got a refresh on the outside with all new siding. This true ranch has three bedrooms, one with an amazing fireplace to cozy up to at night. The kitchen has been nicely updated and has a great open layout. This home has great ...
Kansas City
According to statistics, the population in Kansas City, MO amounts to 491,809, which shows decline 1% compared to the previous year. The median age of the city’s residents is 35. The average household income is $54,372, shifting growth 6% from the past year, and the average property value in Kansas City, MO growth 9% to $166,400 throughout the year.
| Population | 491,809 |
| Median Age | 35.2 |
| Poverty Rate | 17% |
| Household Income | $54,372 |
| Number Of Employees | 255,698 |
| Median Property Value | $166,400 |
What is the Average Price of Apartments for Sale in Kansas City, MO?
| Month | Median Price |
|---|---|
| Apr 2024 |
$763,744
|
| Mar 2024 |
$763,744
|
| Feb 2024 |
$763,744
|
| Jan 2024 |
$763,744
|
| Dec 2023 |
$578,474
|
| Nov 2023 |
$595,598
|
| Month | Median Price |
|---|---|
| Apr 2024 |
$297,675
|
| Mar 2024 |
$260,229
|
| Feb 2024 |
$260,229
|
| Jan 2024 |
$260,229
|
| Dec 2023 |
$284,580
|
| Nov 2023 |
$294,244
|
Household Income
The average household income in Kansas City, MO grew from $51,330 to $54,372 in the past year. This data is an estimate based upon 207,377 households in Kansas City, MO . The chart below presents how household income is distributed in Kansas City, MO in comparison to the revenue allocation amid households nationally.
Property Value
According to data from last year, the average property value in Kansas City, MO shifted from $152,900 to $166,400 throughout the year. The subsequent graph indicates the share of properties in the given price range in Kansas City, MO in comparison to the median property value in the same price segment across the country. According to the data, the greatest share of Kansas City, MO properties falls in the '$200,000 to $249,999' range, which is lower than the most significant median property across the country.
Rent vs. Own
Property Taxes
One of the most important aspects for property owners is the amount of property taxes. This graph shows distribution of property taxes in Kansas City, MO compared to median property taxes around the country. The prevalent amount of property taxes in Kansas City, MO equals $3000, which is less than the national average.