Overland Park, KS, USA apartments for sale
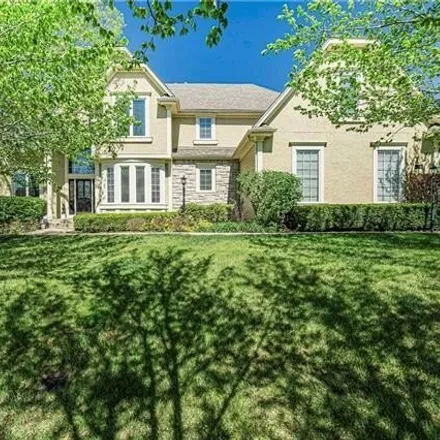
$785,000
$785,000
Available: Right Now
This beautiful 2-story home offers an abundance of space and luxury features throughout, encompassing4, 750sqft of livable space. With 4 bedrooms and 4.5 baths, plus a finished walk-out basement featuring a brand new egress window for a potential 5th...

$225,000
$225,000
Available: Right Now
This 3 bedroom, 2 full bath home is a corner unit. Large living room with a fireplace and vaulted ceilings. The primary suite features a walk-in closet and updated bathroom. Nice sized secondary bedrooms. Newer windows and sliding glass doors. Fenced...
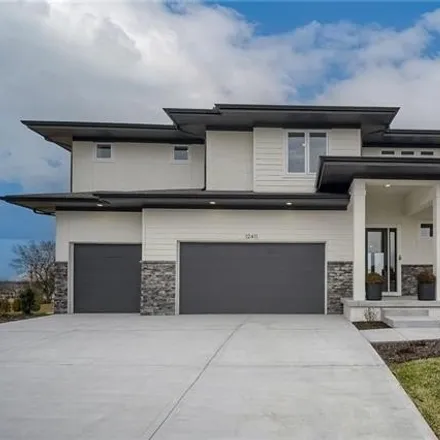
$856,982
$856,982
Available: Right Now
The new Hawthorn EX floor plan by Coventry Builders . this is a model and is not available for sale. This 5 bedroom, 4 bath, 2-story home features a large front porch that opens to a soaring two-story entry! The spacious open living area is co...

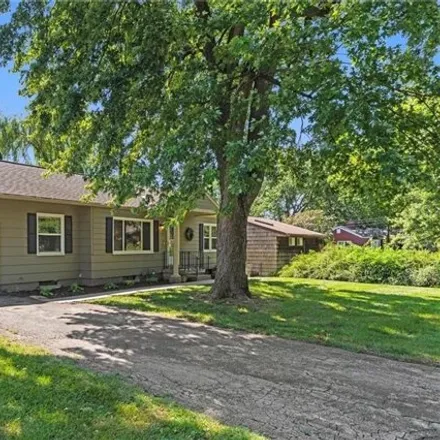
$539,000
$539,000
Available: Right Now
This newly renovated home is a modern oasis of comfort and style. The main level boasts high ceilings, stunning light fixtures and new flooring throughout. The kitchen is equipped with brand-new stainless steel appliances, quartz countertops, and a s...
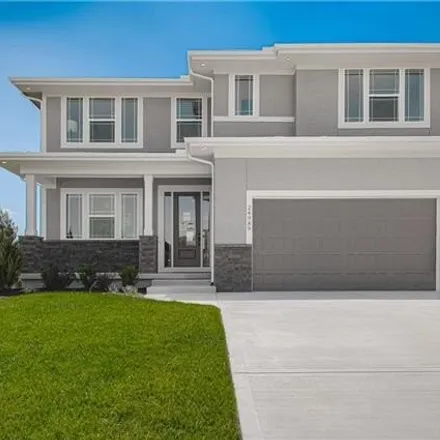
$748,620
$748,620
Available: Right Now
The popular Calistoga 2 Story plan from Inspired Homes is now under construction in Coventry Valley. This plan has 5 bedrooms/4 baths + LOFT + flex space for a Dining Room or Office. Still time to personalize the home with your own selections, or mak...

$3,65M
$3,65M
Available: Right Now
This extraordinary estate exudes elegance, meticulously crafted for those who value privacy and luxury. Nestled at the end of a cul-de-sac on a sprawling 2.33-acre lot, this home boasts a gated entrance, scenic creek views, and dense woodlands. Exqui...

$375,000
$375,000
Available: Right Now
Side to side split w/4 bedrooms and 2 full baths. Beautiful setting features mature oaks on side and back property line along w/a large covered deck. Remodeled Kitchen w/ceramic tile and lots of cabinets - fridge stays. Living room w/vaulted ceiling ...

$949,000
$949,000
Available: Right Now
Welcome to this exquisite residence in the highly desirable Old Leawood neighborhood, where every detail has been carefully crafted to offer a perfect blend of classic appeal and contemporary style. This home has undergone a thorough renovation, ensu...
$285,000
$285,000
Available: Right Now
Come take a look at this wonderful, move in ready ranch home in Mission's Crossland neighborhood before it's too late! Beautiful hardwood floors throughout the house including the bedrooms! Clean, crisp kitchen with all appliances staying including t...
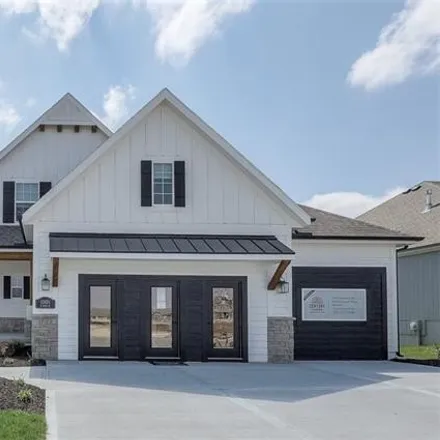
$1,09M
$1,09M
Available: Right Now
The Favorite 1.5 story Berkley II with a modern farmhouse exterior by James Engle Custom Homes on a corner lot backing to a small greenspace area in Century Farms ready for Fall move in. The Berkley II is a great mix of rustic farmhouse with a...

$649,950
$649,950
Available: Right Now
Back on the market with another fantastic price reduction ! You spoke and we listened! What a great opportunity to live in coveted Lionsgate by the Park! Originally a model home for the community, this popular two story home has dual staircase...

$365,000
$365,000
Available: Right Now
You found the one !! We are back on the market...our buyers funds fell through, no inspections were done. Newer roof, paint and plank flooring. Beautiful New kitchen with a great island, granite counters and nice cabinets! Plus new appliances ...
$1,1M
$1,1M
Available: Right Now
Wow villa - new construction best location in the city 60 days out from completion beautiful villa 3 bed/3 bath in a service provided (lawn and snow care) gated community lifestyle in the heart of Prairie Village! Open main level living w/lots...

$985,000
$985,000
Available: Right Now
Come check out this recently updated home located in the highly sought-after Bridgewood subdivision in Leawood. This beautiful corner lot sits with a front circle drive and a back newly expanded deck. The perfect entertaining home! Large main level i...

$589,500
$589,500
Available: Right Now
Introducing the Karie reverse 1.5 story villa by Pauli Homes. Located in Crestwood Village, a luxury maintenance provided community. Enjoy this stunning home with an open concept floorplan giving you tons of natural light throughout the great room w/...

$895,000
$895,000
Available: Right Now
All zero entry ! 1 year old turn-key contemporary villa style custom home ! Amazing lake views! Owner is being transferred. Raised Grand entry with 25 foot ceilings and custom double doors. Custom tile throughout $30K. Italian like cust...

$874,950
$874,950
Available: Right Now
WHEELER' S new 1.5 story plan backs to trees on a daylight lot with covered deck. wilshire hills is ashner development ' S newest blue valley neighborhood. beautiful winding entry leads to secluded, wooded cul de sacs. amenities coming soon...

$620,000
$620,000
Available: Right Now
Spectacular Home in Shadow Brook that Checks all the boxes ! As you arrive , circle drive offering plenty of parking for guests . oversized Lot w/ 15, 333Sq Ft, offering expansive front and back yards. Fenced backyard w/ mature t...

$185,000
$185,000
Available: Right Now
This ground-level condo in The Crossings is a renovated 2-bedroom, 2-bathroom unit featuring modern amenities and a secluded, quiet location at the back of the complex. The property has two outdoor spaces, an updated kitchen with a laundry closet, re...

$245,000
$245,000
Available: Right Now
Spacious 2 story townhome in the heart of Overland Park. Townhome is located on the coveted END unit plus you have two assigned parking spots so no stress parking. The living room and dining room lead into each other and allow a beautiful, spacious a...

$1,49M
$1,49M
Available: Right Now
Welcome to this showstopper home, where high-end designer finishes and meticulous attention to detail create an unparalleled living experience. Step into the inviting open floor plan with a soaring 2-story great room that features exposed truss beams...

$585,000
$585,000
Available: Right Now
This beautiful 4-bed, 3-bath, two-story home has been lovingly maintained by its original owner. Stepping inside you will be wowed with 18' ceilings in the living and dining rooms. The spacious kitchen is a chefs delight, featuring stained cabinets, ...
Overland Park
According to statistics, the population in Overland Park, KS amounts to 186,147, which shows growth 1% compared to the previous year. The median age of the city’s residents is 38. The average household income is $78,217, shifting growth 5% from the past year, and the average property value in Overland Park, KS growth 5% to $248,100 throughout the year.
| Population | 186,147 |
| Median Age | 37.9 |
| Poverty Rate | 6% |
| Household Income | $78,217 |
| Number Of Employees | 101,609 |
| Median Property Value | $248,100 |
What is the Average Price of Apartments for Sale in Overland Park, KS?
| Month | Median Price |
|---|---|
| Jun 2024 |
$268,043
|
| May 2024 |
$288,853
|
| Apr 2024 |
$258,982
|
| Mar 2024 |
$258,982
|
| Feb 2024 |
$258,982
|
| Jan 2024 |
$258,982
|
| Month | Median Price |
|---|---|
| Jun 2024 |
$502,636
|
| May 2024 |
$499,206
|
| Apr 2024 |
$582,393
|
| Mar 2024 |
$582,393
|
| Feb 2024 |
$582,393
|
| Jan 2024 |
$582,393
|
Household Income
The average household income in Overland Park, KS grew from $74,789 to $78,217 in the past year. This data is an estimate based upon 76,621 households in Overland Park, KS . The chart below presents how household income is distributed in Overland Park, KS in comparison to the revenue allocation amid households nationally.
Property Value
According to data from last year, the average property value in Overland Park, KS shifted from $237,100 to $248,100 throughout the year. The subsequent graph indicates the share of properties in the given price range in Overland Park, KS in comparison to the median property value in the same price segment across the country. According to the data, the greatest share of Overland Park, KS properties falls in the '$300,000 to $399,999' range, which is higher than the most significant median property across the country.
Rent vs. Own
Property Taxes
One of the most important aspects for property owners is the amount of property taxes. This graph shows distribution of property taxes in Overland Park, KS compared to median property taxes around the country. The prevalent amount of property taxes in Overland Park, KS equals $3000, which is less than the national average.