Riverside, CA, USA apartments for sale
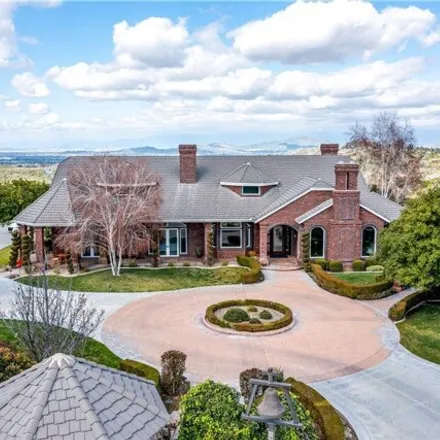
$2,55M
$2,55M
Available: Right Now
Located within the exclusive estates of Hawarden Meadows of Overlook Parkway in one of the most exclusive areas of Riverside is this custom-built home. It stands as a testament to luxury, elegance, and unparalleled views. Set against the backdrop of ...
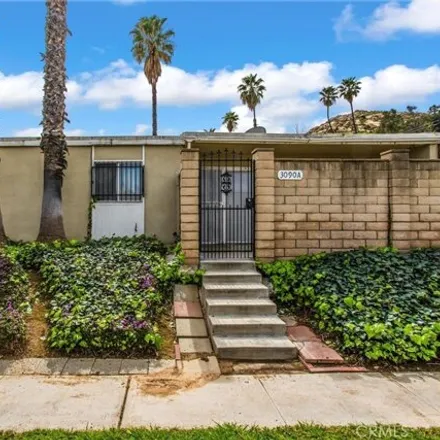
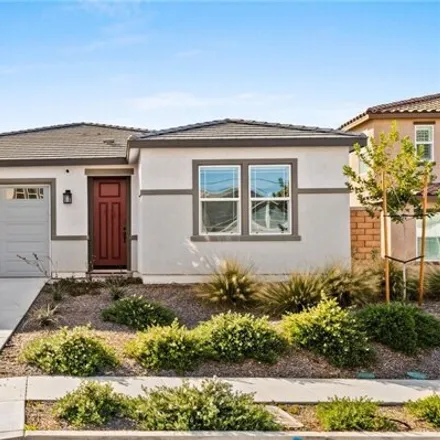
$380,000
$380,000
Available: Right Now
Welcome to your new home or investment property! This is a single level home with tile floors throughout the home. The family room has a fireplace with wall to wall windows for lots of natural light, leading out to the gated private patio. Bedrooms a...
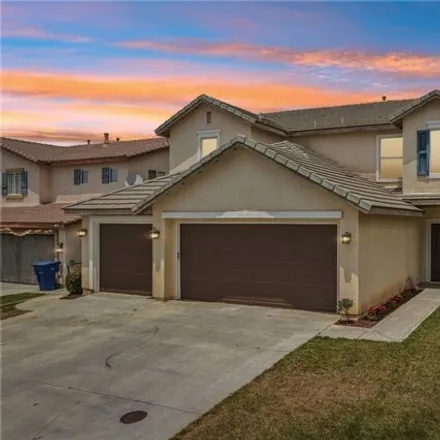
$776,000
$776,000
Available: Right Now
Situated within the highly coveted Orange Crest community renowned for its exceptional educational institutions, this residence epitomizes desirability. Offering abundant potential, the home boasts a thoughtfully designed floor plan. The kitchen, a f...
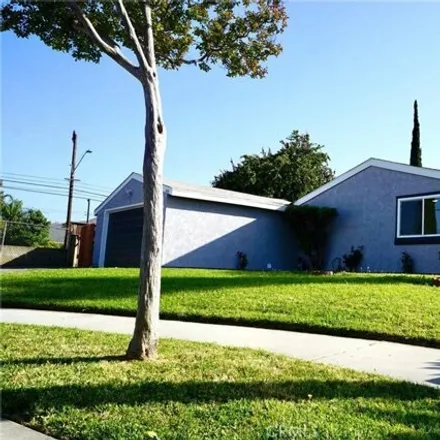
$635,000
$635,000
Available: Right Now
Charming Remodeled house in La Sierra- South featuring 3 Bedrooms 2 Baths with 2 car garage. Property has been painted throughout, Living room and eating area with a high ceiling and has been painted with details, remodeled kitchen with Quartz counte...
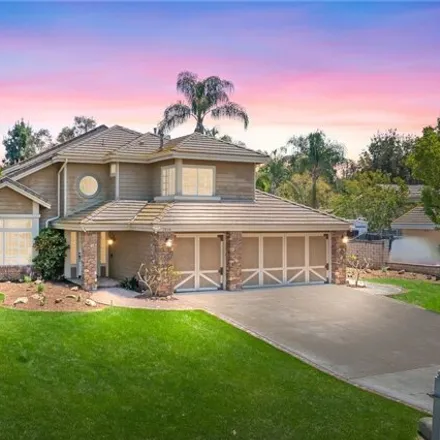
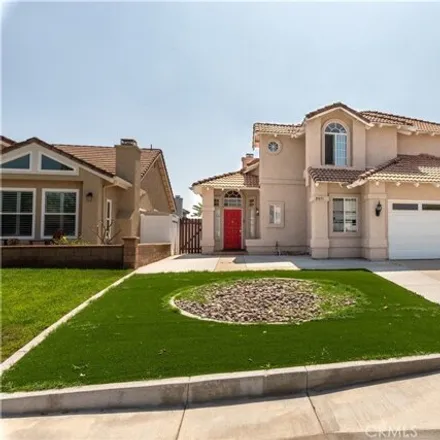
$995,000
$995,000
Available: Right Now
Welcome to Allesandro Heights, where this stunning home, lovingly maintained by its original owner, awaits you. Step inside to discover the perfect blend of elegance and comfort, with an Expansive formal living room featuring a cozy fireplace, vaulte...

$899,000
$899,000
Available: Right Now
Location... location... location... Absolute Stunning one of a kind -pool home w/view, cul-de-sac pride of ownership with incredible Views of mountains in a highly sought out Mission Grove Neighborhood! Best area of Riverside, ne...

$795,000
$795,000
Available: Right Now
This is a spacious three-bedroom, two-bathroom house with a flex room. The interior has a modern atmosphere, featuring a mix of neutral colors. The open living and dining room space offers flexibility and creativity. The kitchen is sleek, with beauti...

$569,000
$569,000
Available: Right Now
Welcome to your dream home in the thriving city of Jurupa Valley! This charming single-story residence boasts 3 spacious bedrooms and 2 modern bathrooms, perfectly laid out over1, 148square feet. Built in 1983, this gem sits on a generous5, 663square...

$695,000
$695,000
Available: Right Now
Welcome to your dream home! This stunning horse property offers the perfect blend of country charm and modern convenience. Nestled on a sprawling, picturesque lot, this home is ideal for equestrian enthusiasts and those seeking a serene lifestyle. St...
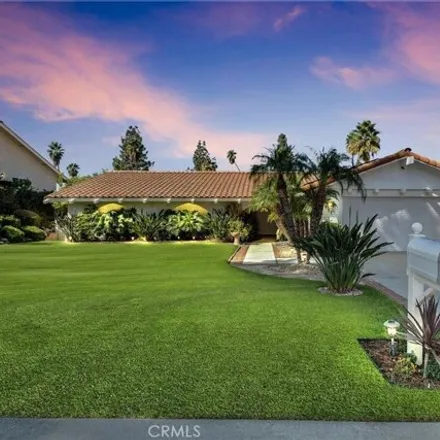
$925,000
$925,000
Available: Right Now
Welcome to this exquisite single-story home that effortlessly blends sophistication with comfort, perfectly situated with views of the pristine Canyon Crest Country Club golf course and Lake. Boasting four spacious bedrooms and two immaculate bathroo...

$1,48M
$1,48M
Available: Right Now
Welcome to your dream home in the prestigious Ridge Ranch Estates of Norco Hills, and Hidden Valley Golf Course. This luxury estate offers everything a high-end buyer could desire, with 5 bedrooms, 4.5 baths, and an expansive5, 073sq ft of living spa...

$590,000
$590,000
Available: Right Now
Sitting pretty on University Avenue in the Evergreen Quarter Historic District is this quintessential Craftsman Bungalow. This home was built in 1913 by the Riverside Building and Labor Company and designed by W. D. Erdice, who also designed and buil...
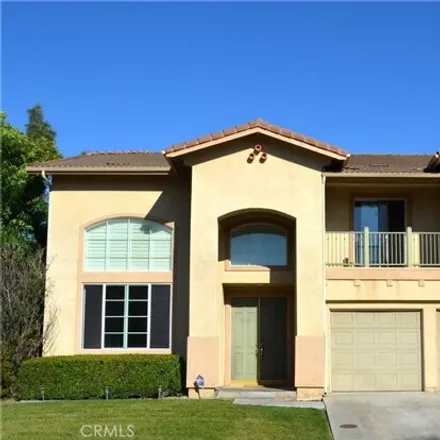
$999,999
$999,999
Available: Right Now
Welcome to your dream home at 11552 Brookrun Ct, nestled in the serene Montecito gated community of western Riverside. This immaculate residence offers a perfect blend of modern comfort and timeless elegance. Located 1 mile from the 91 Fwy and within...

$650,000
$650,000
Available: Right Now
Eureka! Welcome to your new home nestled neatly in the back of the beautiful (City Approved so Soon to be gated ) Coronado Neighborhood at the Riverwalk. You will immediately notice the open spacious floorplan, a beautifully upgraded kitchen (...
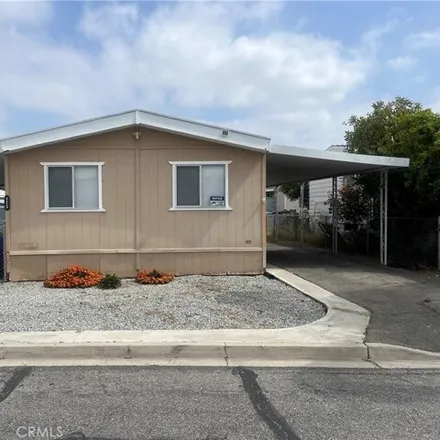
$130,000
$130,000
Available: Right Now
Welcomw to King Arthur Estates all ages community park located in the wonderful city of Riverside. This home is in Turnkey move in ready. This home will come with new washer/dryer, dishwasher, stove, refrigerator. enjoy a nice backyard. Home does hav...
$634,500
$634,500
Available: Right Now
Welcome to 7541 Citrusmoon Court! This beautiful single-story home boasts four bedrooms and two bathrooms, offering ample space and comfort. The interior is adorned with an abundance of natural light, thanks to numerous windows and high ceilings that...

$690,000
$690,000
Available: Right Now
Welcome to this beautiful home in the great city of Riverside California. This home is located in a gated community and offers 5 spacious bedrooms and 3 bathrooms, with one of the bedrooms and bathrooms being downstairs. The downstairs bedroom gives ...

$595,000
$595,000
Available: Right Now
Welcome Home to the highly desired private gated community of Crawford Country Estates This beautifully remodeled and upgraded home offers one of the best locations the complex has to offer, overlooking the beautiful pool/spa area as well as a large ...

$1,25M
$1,25M
Available: Right Now
Nestled in scenic Riverside; minutes from UCR in the University Hills neighborhood, this iconic post-and-beam residence, built in 1965 by architect Philip Esbensen for his family, stands as a beacon of mid-century modern design and architectural hist...

$620,000
$620,000
Available: Right Now
Stunning remodeled home in a prime location! This beautifully upgraded property offers brand new everything, from modern fixtures to new appliances and sleek finishes. Enjoy the perfect blend of comfort and convenience, with schools, parks, transport...

$1,4M
$1,4M
Available: Right Now
Experience the epitome of luxury living in this stunning Victoria Woods home, meticulously updated for modern comfort and style. Situated on a sprawling half-acre corner lot, this single-level residence boasts 5 bedrooms, 3.5 baths, plus an office wi...
$700,000
$700,000
Available: Right Now
Gorgeous 3 bedroom, 2.5 bath home in the Orangecrest area of Riverside! There is a spacious living room , formal dinning space with high ceilings, a fireplace and large windows that let in abundant natural light. The remodeled open kitchen has lots o...
Riverside
According to statistics, the population in Riverside, CA amounts to 330,080, which shows decline 1% compared to the previous year. The median age of the city’s residents is 31. The average household income is $67,850, shifting growth 1% from the past year, and the average property value in Riverside, CA growth 4% to $385,000 throughout the year.
| Population | 330,080 |
| Median Age | 31.2 |
| Poverty Rate | 17% |
| Household Income | $67,850 |
| Number Of Employees | 156,254 |
| Median Property Value | $385,000 |
What is the Average Price of Apartments for Sale in Riverside, CA?
| Month | Median Price |
|---|---|
| Jun 2024 |
$402,581
|
| May 2024 |
$430,628
|
| Apr 2024 |
$444,098
|
| Mar 2024 |
$444,098
|
| Feb 2024 |
$444,098
|
| Jan 2024 |
$444,098
|
| Month | Median Price |
|---|---|
| Jun 2024 |
$626,974
|
| May 2024 |
$628,928
|
| Apr 2024 |
$650,659
|
| Mar 2024 |
$618,139
|
| Feb 2024 |
$618,139
|
| Jan 2024 |
$618,139
|
Household Income
The average household income in Riverside, CA grew from $66,928 to $67,850 in the past year. This data is an estimate based upon 87,341 households in Riverside, CA . The chart below presents how household income is distributed in Riverside, CA in comparison to the revenue allocation amid households nationally.
Property Value
According to data from last year, the average property value in Riverside, CA shifted from $368,600 to $385,000 throughout the year. The subsequent graph indicates the share of properties in the given price range in Riverside, CA in comparison to the median property value in the same price segment across the country. According to the data, the greatest share of Riverside, CA properties falls in the '$300,000 to $399,999' range, which is higher than the most significant median property across the country.
Rent vs. Own
Property Taxes
One of the most important aspects for property owners is the amount of property taxes. This graph shows distribution of property taxes in Riverside, CA compared to median property taxes around the country. The prevalent amount of property taxes in Riverside, CA equals $3000, which is less than the national average.