Santa Monica, CA, USA apartments for sale
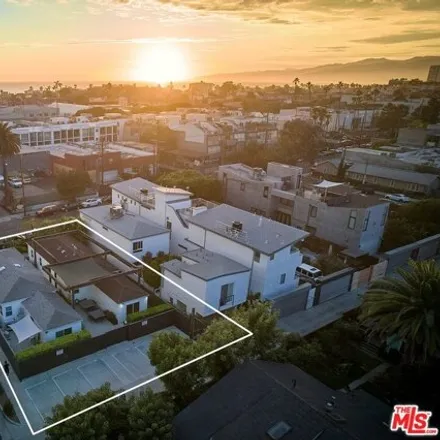
$3,5M
$3,5M
Available: Right Now
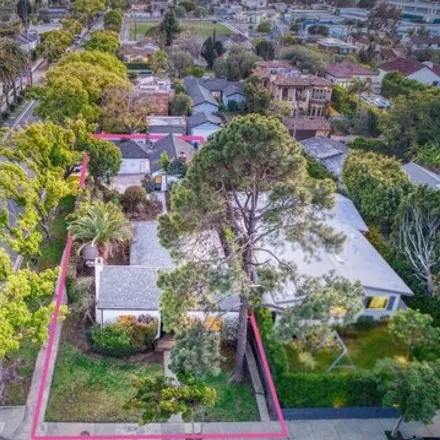
Incredible opportunity - rare 5, 800 + sqft Double lot w / two charming bungalow residences - commercial zoning w / 6 parking spaces. This creative compound in the heart of Venice, just behind Abbot Kinney and a short stro...
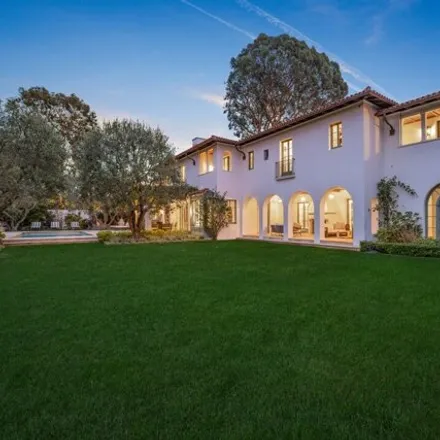
$20M
$20M
Available: Right Now
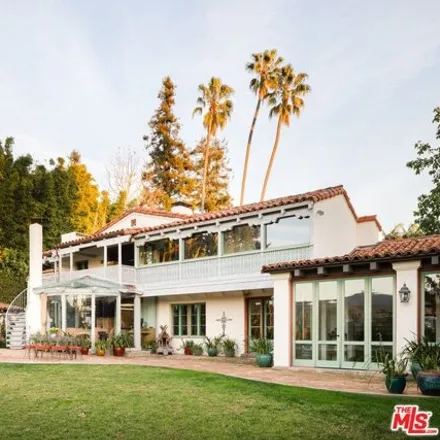
This stunning California Mediterranean residence, nestled in the sought-after street of the Pacific Palisades' Riviera neighborhood, presents a rare opportunity to own one of the Westside's most exquisite properties. Crafted by acclaimed architect Th...
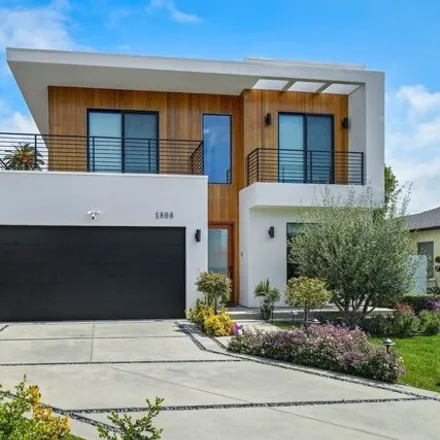
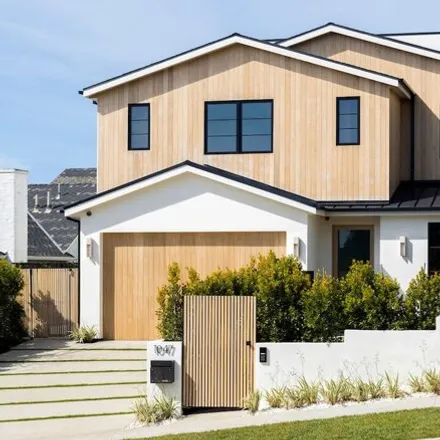
$3,9M
$3,9M
Available: Right Now
Nestled in a vibrant Westside neighborhood, discover a remarkable contemporary home with 5-bedrooms, 6-bathrooms and a hedge-lined backyard with pool and spa. Spanning4, 494square-feet, the open-concept layout features light-toned hardwood floors, hi...
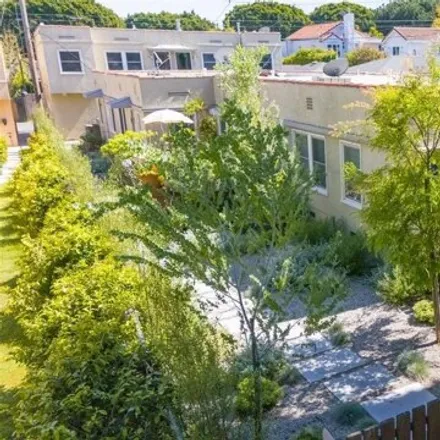
$3M
$3M
Available: Right Now
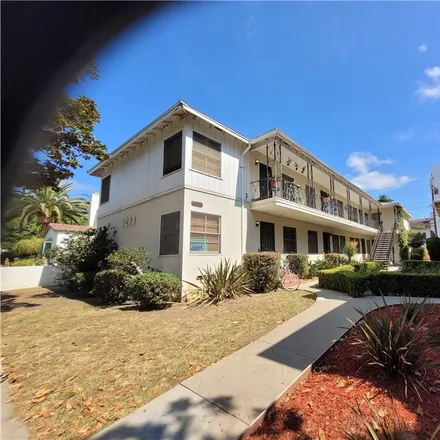
$ 2, 000, 000 assumable loan. 4 % interest only until 2029 for qualified buyer (private 3rd party lender). Two blocks from Snapchat. Very well maintained building with character. 6 charming, one bedroom units located on quiet tree-lined street...
$4,2M
$4,2M
Available: Right Now
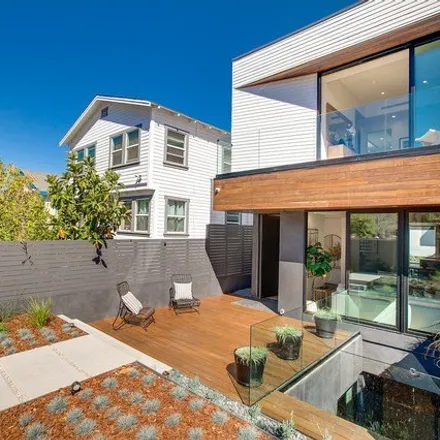
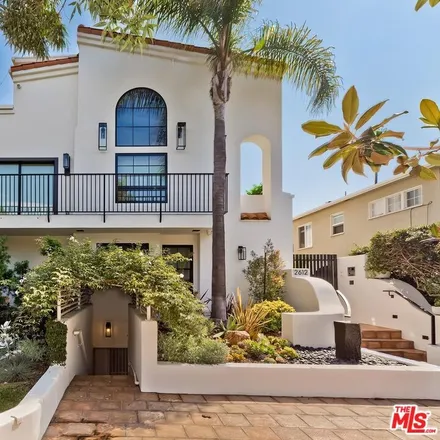
This truly creative and trend setting newly constructed home, is one of Venice's most spectacular residences, encompassing the best design, location and size. Situated on a charming walk street one block from the beach, this exceptional home boasts 5...
$1,1M
$1,1M
Available: Right Now
Welcome to this lovely warm and original back facing quiet 2 bedroom | 2 bath unit. This is the best valued original 2 bedroom unit on Ocean Ave in Santa Monica. This efficient floor-plan flows from the living space to the dining area and into your g...
$4,9M
$4,9M
Available: Right Now
Ultimate Owner/user opportunity in the Franklin School District of Santa Monica! True pride of ownership building located steps to Montana Ave and North of Wilshire. Front owner townhome is a 3 bed + 3 bath with approx. 2, 300sf of living spac...
$8,45M
$8,45M
Available: Right Now
Huge $500, 000 price reduction. We are pleased to offer for sale rare multifamily assets at 937 and 943 2nd Street in the coveted beachside community of Santa Monica. These side by side properties each have their own APN and share a beautiful ...
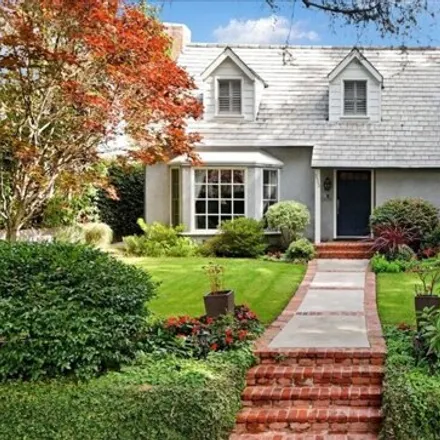
$5,5M
$5,5M
Available: Right Now
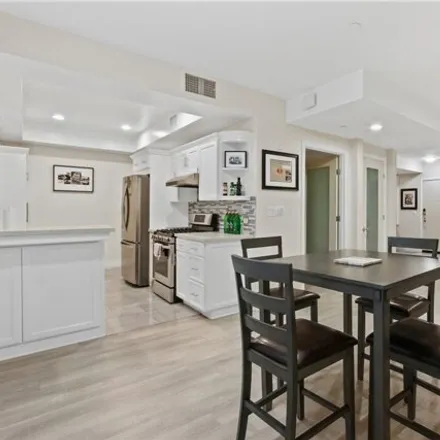
This exquisite property offers a perfect blend of luxury, comfort, and convenience, with its prime location and impressive features. Boasting 5 bedrooms, 4.5 bathrooms, and an office, this spacious home spans across3, 325square feet, providing ample ...
$9,38M
$9,38M
Available: Right Now
Explore a truly exceptional modern retreat in the prestigious Pacific Palisades, meticulously crafted by Shelter Homes with new upgrades and privacy features. This residence effortlessly blends indoor and outdoor living spaces, allowing natural light...
$749,900
$749,900
Available: Right Now
Welcome to a perfectly located first floor condo unit in a newer mid-rise building. Special floor plan includes an extra room attached to the living room which could be an office, entertainment room or guest bedroom perhaps. This room has direct acce...
$1,3M
$1,3M
Available: Right Now
Nestled in an incredible location, this charming property presents an exceptional opportunity for buyers, savvy investors and developers alike. With its original charm intact, this 2 bedroom, 1 bath property exudes character and potential, providing ...
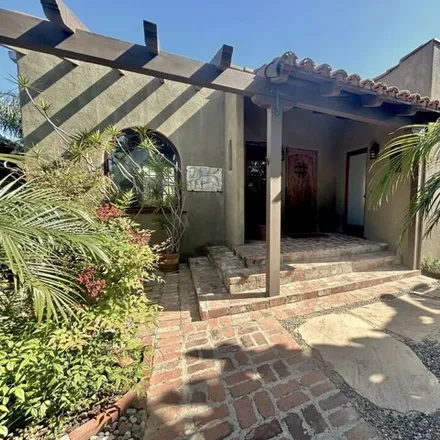
$2,5M
$2,5M
Available: Right Now
Nestled behind tall palms, this serene mini compound in Venice, West of Lincoln, takes full advantage of Southern California's indoor-outdoor lifestyle. Walk into the warm interior, an artists paradise - boasting vintage details, hand troweled plaste...
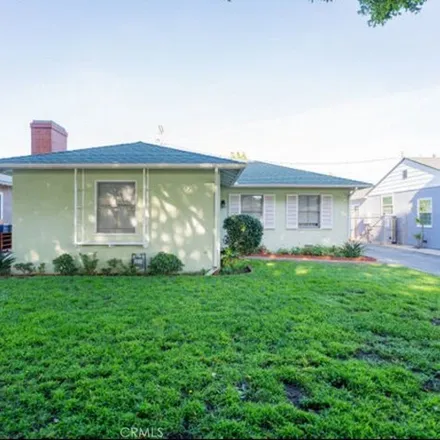
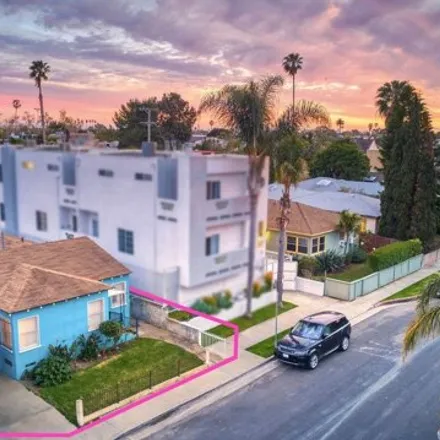
$2M
$2M
Available: Right Now
Charming 3-bedroom, 1-bathroom home available in Santa Monica, offering a perfect blend of comfort and convenience. Nestled in a prime location near Interstate 5 and 10 freeways, this property ensures easy access to transportation. The residence feat...
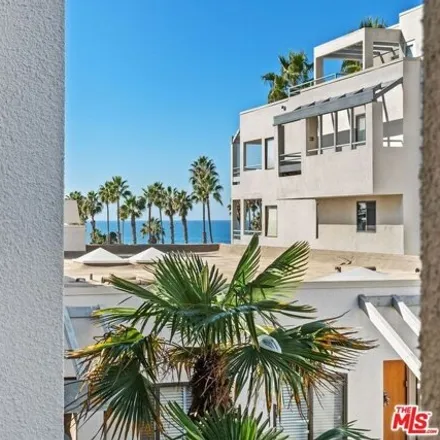
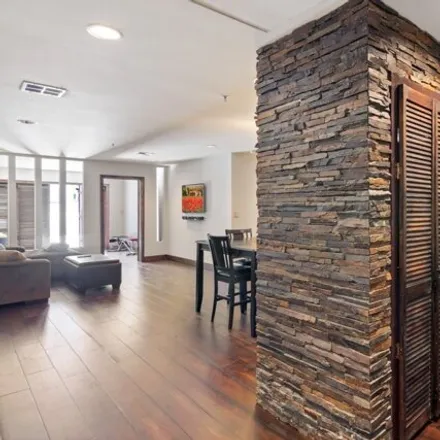
$1,89M
$1,89M
Available: Right Now
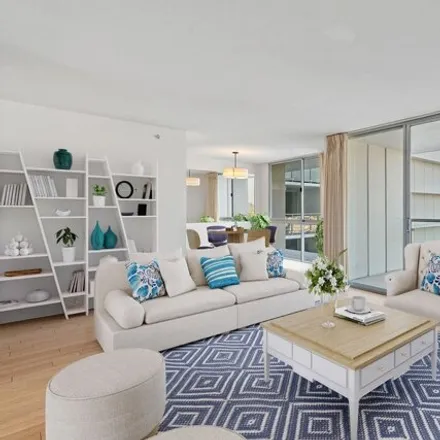
This Luxurious extensively remodeled unit with an open kitchen and hardwood flooring throughout is nestled in the heart of Santa Monica, 140 Ocean Park Blvd offers a rare opportunity to experience the epitome of Southern California beachfront living....
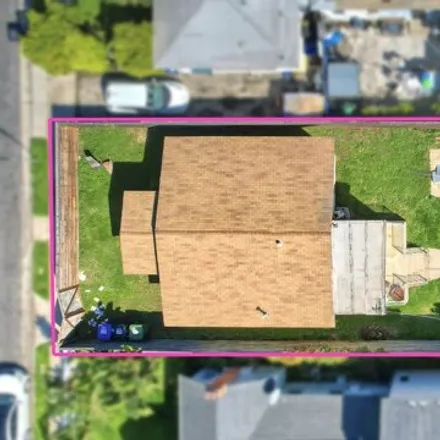
$1,75M
$1,75M
Available: Right Now
Opportunity knocks with this development lot in Venice. Bring your imagination and turn this partially gutted home into your beach paradise. Perfectly situated and zoned for a small lot subdivision, the possibilities for development are boundless. Wh...
$18,45M
$18,45M
Available: Right Now
Nestled in prestigious Santa Monica, find 1707 San Vicente Boulevard, a beautiful Mediterranean-style residence with a rich history dating back to its construction in 1924. The estate encompasses43, 093square feet, a two-level main house and a single...
$2,8M
$2,8M
Available: Right Now
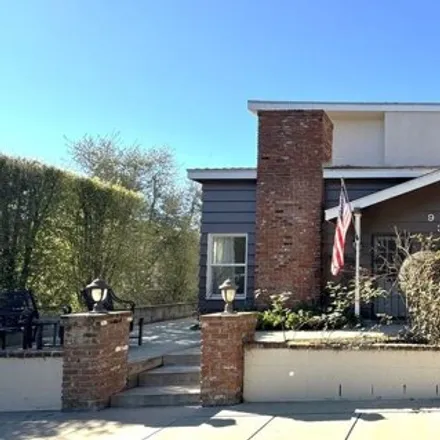
Exceptional opportunity in the coveted Santa Monica location! This incredible gem is on the market for the first time in 50+ years - perfect for owners/users, developers, and investors alike - bring your vision to create the home of your dreams! Situ...
$2,85M
$2,85M
Available: Right Now
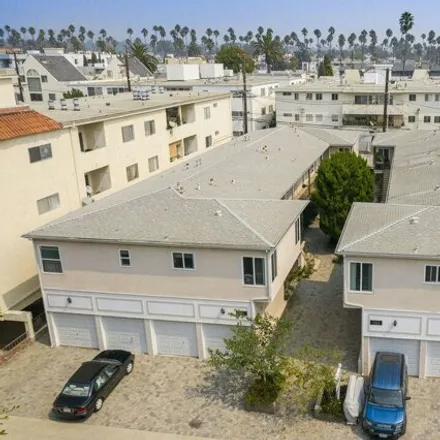
Accepted offer of$2, 580, 000.Overbidding will start at$2, 710, 550.Court date and time will be published once known. Trust Sale, court confirmation required. Excellent opportunty to own this 8 unit building close to all the great restaurants and sho...
$1,45M
$1,45M
Available: Right Now
Charming Santa Monica townhome with a beautiful, modern Spanish exterior. The unit has 2 bedroom suites and a laundry closet on the first level. The primary suite features a large walk in closet, en-suite bathroom, and private patio. The upstairs liv...
$1,3M
$1,3M
Available: Right Now
Location, Location, Fully remodeled three bedroom, three bathroom built in 1999 with stainless steal appliances, quartz counter tops, breakfast bar in the kitchen that open to the dining area, living room and family room with a fireplace, plantation ...
$3,5M
$3,5M
Available: Right Now
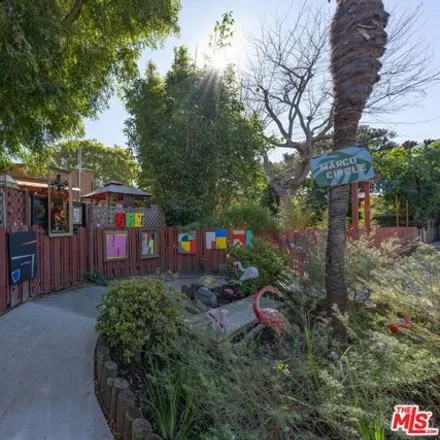
Lee and Associates Apartment Advisors is pleased to present Marco Circle apartments located in Venice, CA. First time on the market in 40 years! The property is situated on the world-famous Walk Streets of Venice, and is the only apartment property o...
Santa Monica
According to statistics, the population in Santa Monica, CA amounts to 92,495, which shows decline 0% compared to the previous year. The median age of the city’s residents is 41. The average household income is $86,084, shifting growth 5% from the past year, and the average property value in Santa Monica, CA growth 8% to $1,168,500 throughout the year.
| Population | 92,495 |
| Median Age | 40.5 |
| Poverty Rate | 11% |
| Household Income | $86,084 |
| Number Of Employees | 52,669 |
| Median Property Value | $1,168,500 |
Household Income
The average household income in Santa Monica, CA grew from $82,123 to $86,084 in the past year. This data is an estimate based upon 46,358 households in Santa Monica, CA . The chart below presents how household income is distributed in Santa Monica, CA in comparison to the revenue allocation amid households nationally.
Property Value
According to data from last year, the average property value in Santa Monica, CA shifted from $1,086,300 to $1,168,500 throughout the year. The subsequent graph indicates the share of properties in the given price range in Santa Monica, CA in comparison to the median property value in the same price segment across the country. According to the data, the greatest share of Santa Monica, CA properties falls in the '$2,000,000 or More' range, which is lower than the most significant median property across the country.
Rent vs. Own
Property Taxes
One of the most important aspects for property owners is the amount of property taxes. This graph shows distribution of property taxes in Santa Monica, CA compared to median property taxes around the country. The prevalent amount of property taxes in Santa Monica, CA equals $3000, which is less than the national average.