Tigard, OR, USA apartments for sale
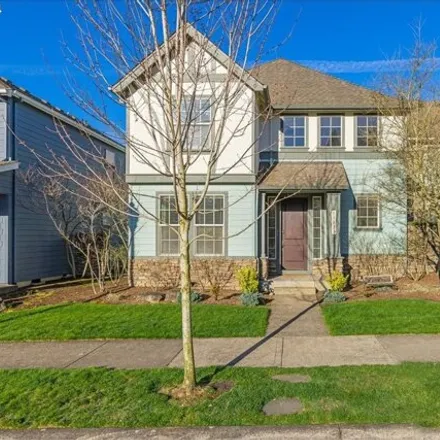
$625,000
$625,000
Available: Right Now
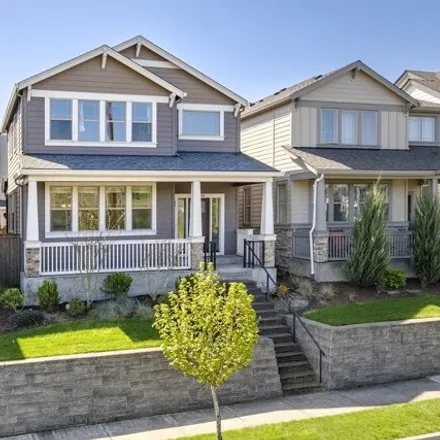
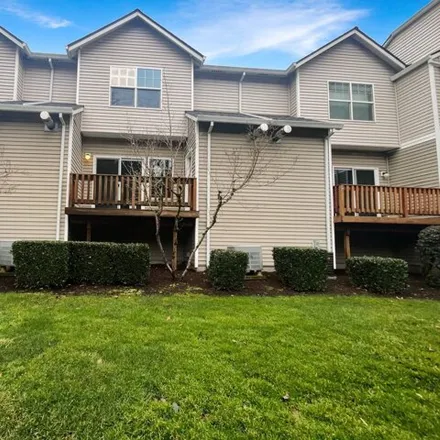
Discover your sanctuary in this beautiful traditional home nestled within the vibrant River Terrace Master Planned Community. Step into the inviting, open plan Great Room, a sunlit haven with a cozy gas fireplace, creating the perfect ambiance for ga...
$1,3M
$1,3M
Available: Right Now
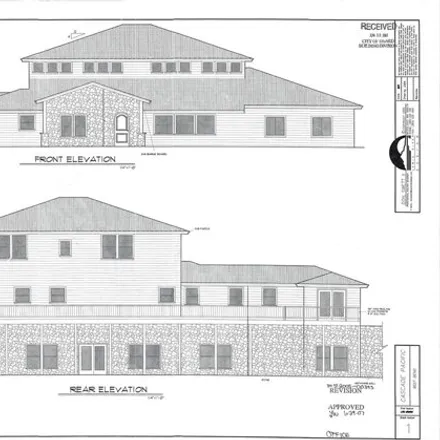
This expansive9, 052square foot work in process is set on a generous 1.5-acre lot, a property brimming with potential and unique features. Tall fir trees and a territorial view signal a stately presence. It stands as an exceptional opportunity for in...
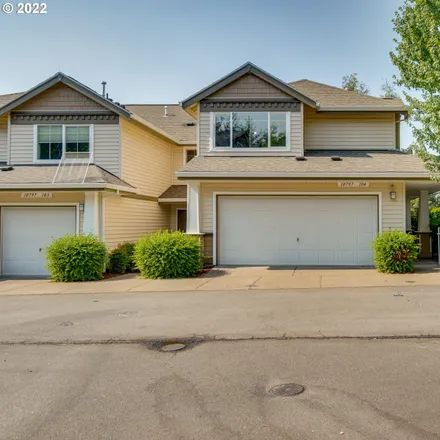
$759,000
$759,000
Available: Right Now
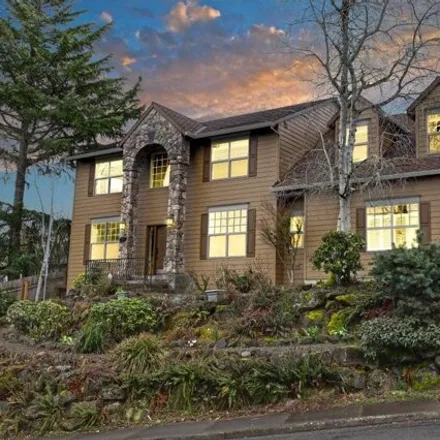
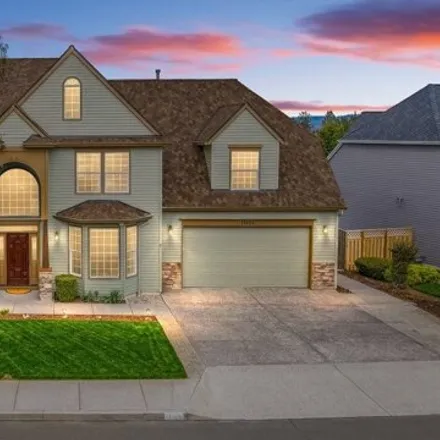
Imagine on a clear day, waking up to a view of Mt. Hood in the wonderful community of Bull Mountain! This spacious2, 745Sq Ft home has commanding curb appeal as it is perched on its lot with side entry garage off the half cul-de-sac. With 3 bedrooms ...
$299,900
$299,900
Available: Right Now
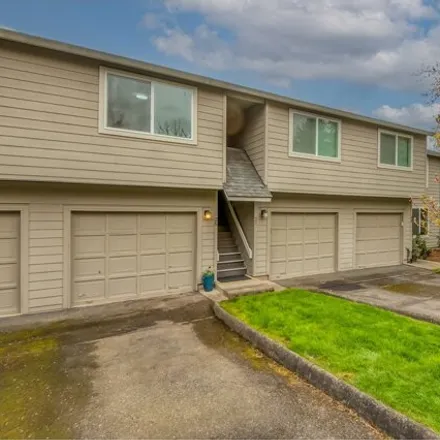
Newly refreshed and darling condo in a great complex- Tigard Woods! Open and light, this unit has all new paint throughout including cabinets, fireplace, trim and doors. Also new: carpet, fixtures, hardware, stainless appliances. Living room has wood...
$715,000
$715,000
Available: Right Now
Sellers are offering 1% of sale price towards buyers closing costs! Discover refined living in this 4-bed, 2.5-bath Bull Mountain haven, seamlessly blending comfort, style, and functionality. The open living space flows into a gourmet kitchen with hi...
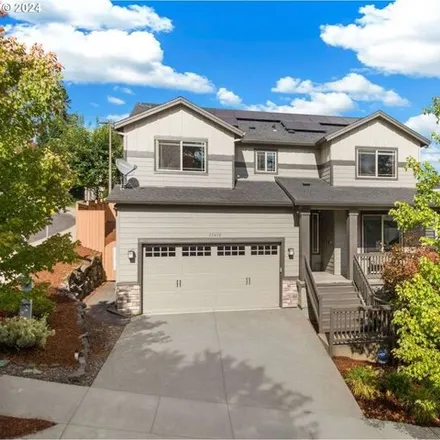
$619,000
$619,000
Available: Right Now
Dynamite home with modern improvements, built by Legend homes in popular Edgewater neighborhood. Solar panels are owned, no cost to owner-BIG savings on electricity! Brand new furnace in 2023. Refinished hardwood floors and new carpet on main level. ...
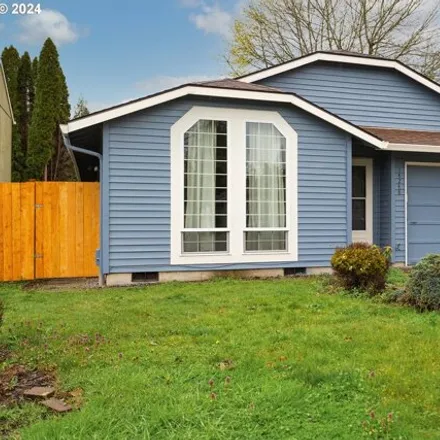
$489,500
$489,500
Available: Right Now
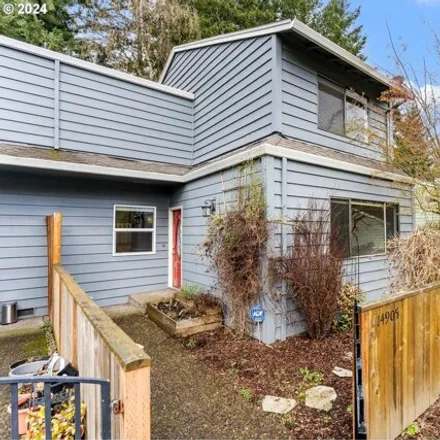
Presenting a 3-bedroom, 2-full bathroom single-family home with a single attached garage, located on a quiet street in Tigard. This well-maintained residence features vaulted ceilings, providing a spacious feel throughout. The kitchen has been recent...
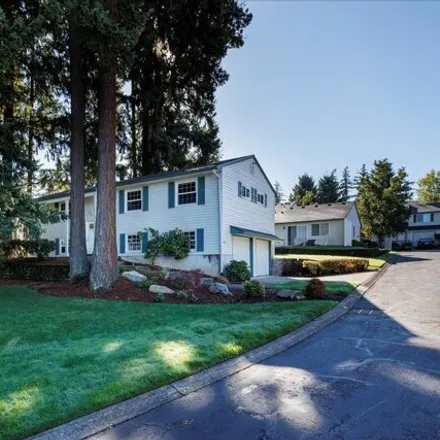
$575,000
$575,000
Available: Right Now
A lot of love and thought has gone into this home over the past years. Now it is time to turn this turnkey home over to the next owner where they can make their dreams come true too! From the gorgeous bamboo hardwood floors, to the sprawling living r...
$409,000
$409,000
Available: Right Now
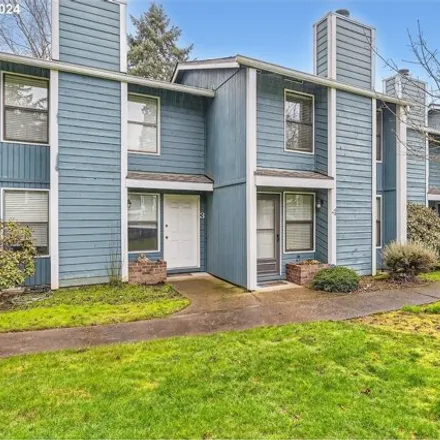
Just listed ! Updated end-unit townhome with desirable 2 bedroom + office floorplan. Two bedrooms upstairs with two full baths. Den on main has desk and built-ins included and can be a second living space or guest room. Features include though...
$1,68M
$1,68M
Available: Right Now
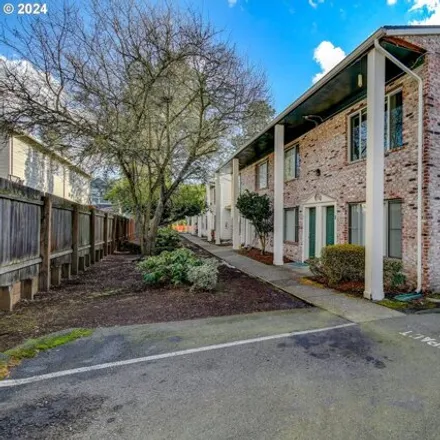
The Greenburg Townhomes are located in the strong sub-market of Tigard, Oregon and are comprised of 8 large townhome style units. Each apartment features 2 bedrooms and 1.5 baths, spacious floor plans, off-street parking, and private back patios. Ten...
$549,990
$549,990
Available: Right Now
MLS#24602317June Completion! The Pioneer at South River Terrace primary focus is to cater to the individual preferences of each occupant, ensuring a satisfying bedroom experience for all. Upstairs on the top floor, all three bedrooms boast walk-in cl...
$1,2M
$1,2M
Available: Right Now
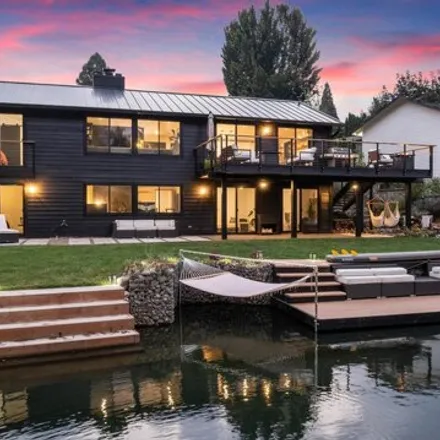
Lakefront property ! Enjoy this one-of-kind home. Architect designed w/modern and Japandi inspirations. Design attention paid to every detail; custom flooring, tile patterns, ceilings, hidden closets w/bookshelf doors, custom doors w/hidden hi...
$410,000
$410,000
Available: Right Now
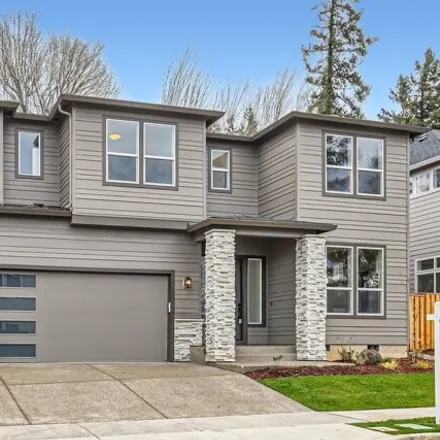
$1,1M
$1,1M
Available: Right Now
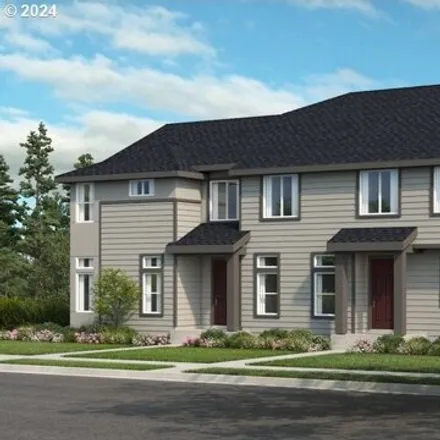
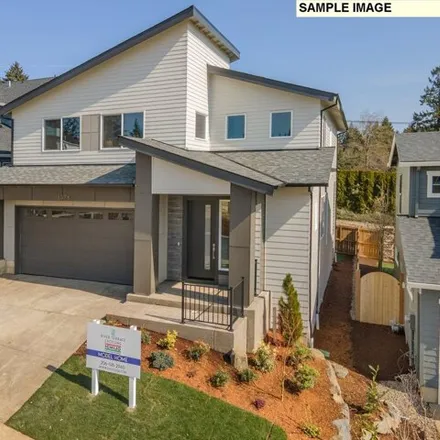
$25K builder credit toward interest rate buy-down. Buy an exceptional home with a low interest rate! Luxury new home community by one of Portland's premiere builders, Westwood Homes, with high-end finishes and exceptional attention to detail! This ma...
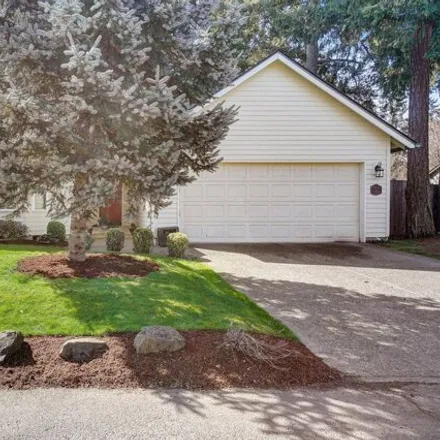
$495,000
$495,000
Available: Right Now
Seller to provide$10, 000towards buyers allowable closing costs w/ acceptable offer. Detached Condo that lives like a single family home, no shared walls. Are you looking for space and privacy, but want low maintenance? This is the home for you. Nest...
$894,950
$894,950
Available: Right Now
Beautiful lightly lived in Move-In Ready home is better than new already including Blinds, AC, Refrigerator, Smart features, PLUS a fully owned 16.8kw Solar System! Fantastic floorplan featuring 4 Bedrooms, 2.1 Baths, Den, Loft/Tech Space and Fully F...
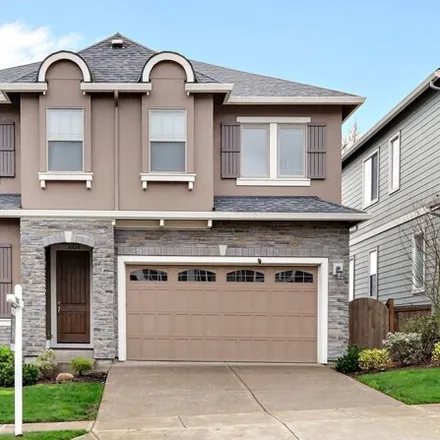
$421,000
$421,000
Available: Right Now
Welcome to this stunning property for sale that exudes charm and elegance! Step into the spacious living area featuring a cozy fireplace, perfect for cuddling up on chilly evenings. The natural color palette throughout the home creates a warm and inv...
$300,000
$300,000
Available: Right Now
Welcome to your new home in Tigard's charming Bonita Firs Village Condos! This inviting 2-bedroom, 1.5-bathroom condo boasts recent upgrades including a complete kitchen remodel and newly installed laminate floors on the first floor, carpet on stairs...
$465,000
$465,000
Available: Right Now
On the lake ! Rare opportunity to own a lake front condo in Progress Ridge w/ a view of the lake & mountains! This 2 bedroom, 2 1/2bath home with a loft has air conditioning, a huge kitchen island, stainless steel appliances, & a deck overlook...
$799,990
$799,990
Available: Right Now
Price reduced! Move-in ready. $30k Buyer Bonus (see below). Ichijo usa brings authentic modern design and energy efficiency to Tigard. Come and see our unique features including fully functional kitchen organization system, custom piano-finish...
$899,900
$899,900
Available: Right Now
Great home in Eagle Pointe with views!Meticulously maintained and cared for. So many major updates:A new complete HVAC system in 2020 Exterior paint in 2020. Roof installed in 2017. All new high end kitchen appliances. So much storage through the hou...
$759,000
$759,000
Available: Right Now
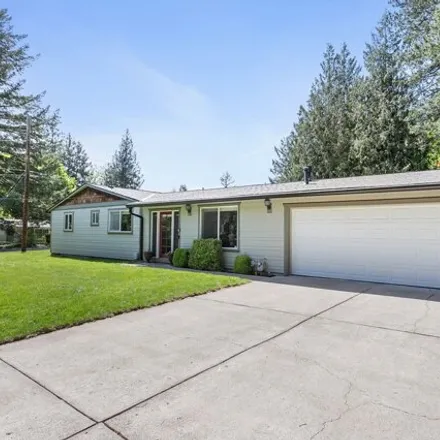
Just listed in Garden Home! This spacious home has over 2000 square feet all on one level, situated on a 1/3 acre corner lot. Featuring 3 bedrooms and 2.5 baths, it has undergone extensive updates, including a full kitchen renovation with new cabinet...
Tigard
According to statistics, the population in Tigard, OR amounts to 51,355, which shows growth 1% compared to the previous year. The median age of the city’s residents is 38. The average household income is $70,120, shifting growth 7% from the past year, and the average property value in Tigard, OR growth 8% to $345,200 throughout the year.
| Population | 51,355 |
| Median Age | 37.7 |
| Poverty Rate | 10% |
| Household Income | $70,120 |
| Number Of Employees | 27,182 |
| Median Property Value | $345,200 |
Household Income
The average household income in Tigard, OR grew from $65,505 to $70,120 in the past year. This data is an estimate based upon 20,421 households in Tigard, OR . The chart below presents how household income is distributed in Tigard, OR in comparison to the revenue allocation amid households nationally.
Property Value
According to data from last year, the average property value in Tigard, OR shifted from $320,100 to $345,200 throughout the year. The subsequent graph indicates the share of properties in the given price range in Tigard, OR in comparison to the median property value in the same price segment across the country. According to the data, the greatest share of Tigard, OR properties falls in the '$300,000 to $399,999' range, which is higher than the most significant median property across the country.
Rent vs. Own
Property Taxes
One of the most important aspects for property owners is the amount of property taxes. This graph shows distribution of property taxes in Tigard, OR compared to median property taxes around the country. The prevalent amount of property taxes in Tigard, OR equals $3000, which is less than the national average.