Vancouver, WA, USA apartments for sale

$850,000
$850,000
Available: Right Now
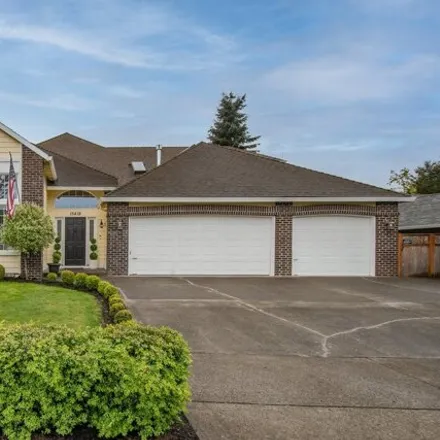
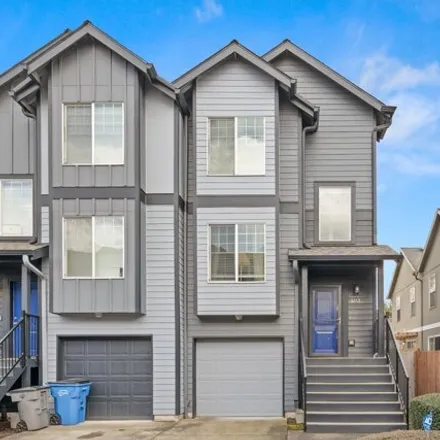
Gorgeous daylight ranch with tasteful updates in a private setting that feels like you are living in the woods while having the convenient location just a short drive to downtown! The private dead end street is lush with trees and is so quiet you can...

$474,900
$474,900
Available: Right Now
Open House Fri. 7/19 from 4-7pm + Sat. 7/20 from 10am-Noon Discover the charm of this eclectic home nestled amongst the trees near the Willamette river. Located in the Cathedral Park neighborhood, you?re just blocks to the vibrant heart of St. Johns ...

$475,000
$475,000
Available: Right Now
Welcome to this charming Cape Cod style home in Vancouver, WA, showcasing original hardwood floors throughout and a delightful secret bonus room above the garage. The open concept layout includes a formal dining space adjacent to the kitchen, ideal f...
$439,995
$439,995
Available: Right Now
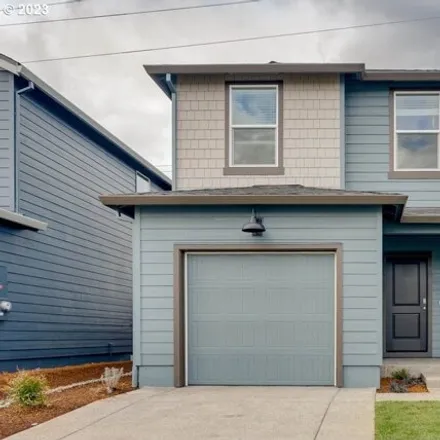
Huge savings with our special interest rate as low as 4.99% 30 year fixed PLUS 11k Buyer bonus!!! with Preferred lender (restrictions apply)! New build homes at Curtin Creek Meadows are selling now. Come explore this brand new community that f...
$519,000
$519,000
Available: Right Now
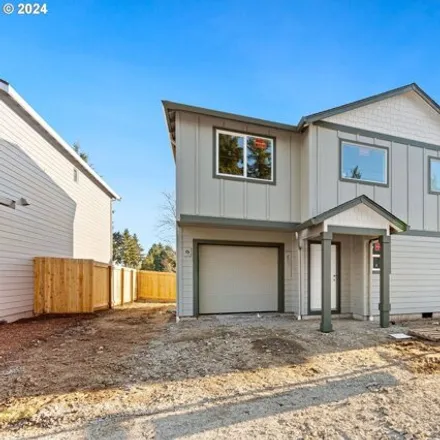
Brand New Construction meets Un-Matched quality and affordability, brought to you by Award winning custom home builder, TimberCrest Homes. Backing to Walnut Grove Neighborhood Park, this well-appointed home has everything you need, and then some. Gra...
$1,1M
$1,1M
Available: Right Now
Don't miss out on your next investment opportunity - a property that has been carefully crafted over the past 7 years with few vacancies to date. This Short Term Rental has everything you could possibly want and more, and it comes fully furnished for...

$429,950
$429,950
Available: Right Now
Welcome to this cozy one-story 960 sq ft residence nestled in Portland! This charming 3 bed, 1 bath home has been updated with new flooring and interior paint throughout. Walk into a wide open living room featuring large windows with an abundance of ...

$625,000
$625,000
Available: Right Now
Front view floating home with panoramic view of North Portland Harbor. Inside the home has been updated with contemporary finishes. Large Island Kitchen is a cook's delight. Very large swim float with ability to moor a large boat. Log and Steel strin...

$499,900
$499,900
Available: Right Now
Welcome to your luxurious 2-story condo w/ modern elegance and convenience. Natural lighting w/ large noise reduction windows throughout. 2 prim stes - one on each floor. The main level ste offers W/I closet, LVP floors, abundant natural light w/ pri...
$300,000
$300,000
Available: Right Now
Island Park condo, great rental (No HOA Approval) or first home investment. The main level features a laundry room and a half bath and a functional galley kitchen that leads into the dining area that opens to living room with Wet bar a floor to ceili...

$527,777
$527,777
Available: Right Now
Openhouse Saturday and Sunday 12-3pm. Welcome to your future home! This well-loved abode boasts 4 bedrooms and 2.5 bathrooms, along with a spacious updated kitchen featuring a Corian island and countertops, cabinets and storage, separate coffe...

$299,900
$299,900
Available: Right Now
This modern condo in a prime location features an open layout flooded with natural light and enhanced by new blinds. It boasts a state-of- art Ecobee smart thermostat for efficiency along with a brandNEW HVACsystem. Fresh paint, laminate flooring, pl...

$635,000
$635,000
Available: Right Now
What a find! Located in Fisher's Landing is a 2-level move-in ready home with a great floor plan and beautiful outdoor space on a corner lot. Plenty of room for your many needs and wants. 2035 sq. ft. with 5 Bedrooms and 2.5 bathrooms. Upon entry you...
$320,900
$320,900
Available: Right Now
End unit townhome with fully fenced backyard, and attached garage! Main level features an open concept living space with half bath and balcony! Great kitchen with an island, and stainless steel appliances. Updated flooring. Upstairs you will find the...

$499,999
$499,999
Available: Right Now
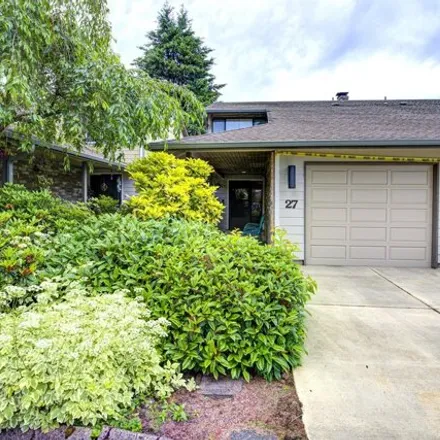
Nearly a quarter acre fenced with RV parking located across the street from Silver Star Elementary. This home has been beautifully updated and well maintained. Enjoy the parklike setting from your wrap around deck. Updated kitchen with slab counters,...

$549,900
$549,900
Available: Right Now
Beautiful light and bright home with updates throughout, on a quiet dead-end street, and only steps to Northgate Park (soon to be Portland's new aquatic center). With large windows, new carpet upstairs (wood floors beneath), new high-end LVP flooring...
$565,000
$565,000
Available: Right Now
Very cute and cozy fully remodeled one-level house. With a huge lot in a very desirable area in town. Zoning R-4. Open-concept home including three bedrooms and two full bathrooms. New kitchen with quartz countertops, double oven, and free-standing f...

$590,000
$590,000
Available: Right Now
This is a great family home! Nestled in a cul de sac, this 2016 build has an open floor plan perfect for family dinners and cozy fires. As you enter, you'll find an office on the main floor, looking out to front garden, enclosed in an adorable picket...

$659,000
$659,000
Available: Right Now
Step inside this charming home that welcomes you with a two-story foyer entry right in the heart of Vancouver Washington. Featuring beautiful modern finishes, Open plan living, high ceilings and lots of windows for natural light. Enjoy plenty of spac...

$670,000
$670,000
Available: Right Now
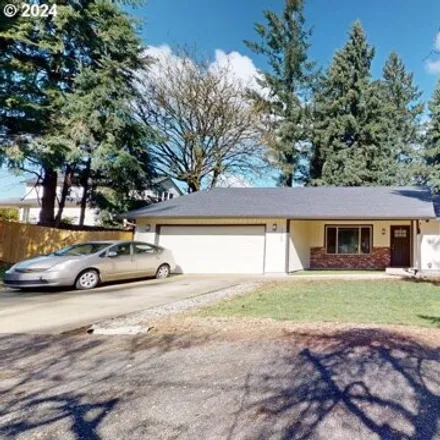
Welcome to this charming ranch-style home. 3-bed, 2-bath, plus bonus room. Enjoy the spacious kitchen equipped with a versatile gas stove that's also wired for electric, providing flexibility for your culinary preferences. Relax in the luxurious jett...
$1,58M
$1,58M
Available: Right Now
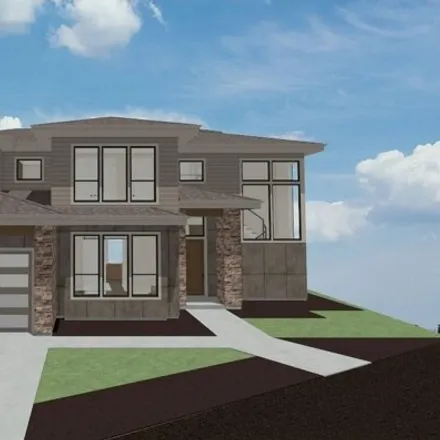
Our Newest SPEC is Starting Soon! We are in for Permits! Step into luxury with this spectacular open floor plan home featuring a Great room adorned with coffered ceilings and a cozy gas fireplace nestled within built-ins. Lots of possibilities with a...

$499,900
$499,900
Available: Right Now
Open house saturday 6/15 1:00 pm - 4:00 pm. Experience this beautiful 3 bed, 2.5 bath home conveniently located just east of downtown Vancouver. This property features an open floor plan, engineered hardwood flooring, granite countertops, and ...
Vancouver
According to statistics, the population in Vancouver, WA amounts to 171,393, which shows decline 1% compared to the previous year. The median age of the city’s residents is 37. The average household income is $55,593, shifting growth 7% from the past year, and the average property value in Vancouver, WA growth 10% to $238,300 throughout the year.
| Population | 171,393 |
| Median Age | 36.6 |
| Poverty Rate | 14% |
| Household Income | $55,593 |
| Number Of Employees | 81,286 |
| Median Property Value | $238,300 |
What is the Average Price of Apartments for Sale in Vancouver, WA?
| Month | Median Price |
|---|---|
| Jun 2024 |
$391,022
|
| May 2024 |
$433,695
|
| Apr 2024 |
$424,715
|
| Mar 2024 |
$424,715
|
| Feb 2024 |
$424,715
|
| Jan 2024 |
$424,715
|
| Month | Median Price |
|---|---|
| Jun 2024 |
$608,864
|
| May 2024 |
$622,128
|
| Apr 2024 |
$605,639
|
| Mar 2024 |
$573,659
|
| Feb 2024 |
$573,659
|
| Jan 2024 |
$573,659
|
Household Income
The average household income in Vancouver, WA grew from $52,004 to $55,593 in the past year. This data is an estimate based upon 68,158 households in Vancouver, WA . The chart below presents how household income is distributed in Vancouver, WA in comparison to the revenue allocation amid households nationally.
Property Value
According to data from last year, the average property value in Vancouver, WA shifted from $217,200 to $238,300 throughout the year. The subsequent graph indicates the share of properties in the given price range in Vancouver, WA in comparison to the median property value in the same price segment across the country. According to the data, the greatest share of Vancouver, WA properties falls in the '$200,000 to $249,999' range, which is lower than the most significant median property across the country.
Rent vs. Own
Property Taxes
One of the most important aspects for property owners is the amount of property taxes. This graph shows distribution of property taxes in Vancouver, WA compared to median property taxes around the country. The prevalent amount of property taxes in Vancouver, WA equals $2500, which is less than the national average.