Vallejo, CA, USA apartments for sale

$520,000
$520,000
Available: Right Now
Nicely appointed single story home in East Vallejo with open floor plan and newer roof. Makes a great home for an owner occupied buyer or add to your investment portfolio. Currently rented for $2600/mo. Upgraded throughout. Updates to the kitchen inc...
$684,900
$684,900
Available: Right Now
This well maintained property is ideal for a large family or investment! This home is aTRIPLEX3bed/3bath per seller (Please check with county) The main home has been divided into two units with 1 bed, 1 bath, kitchen and linving room each. The back u...
$389,900
$389,900
Available: Right Now
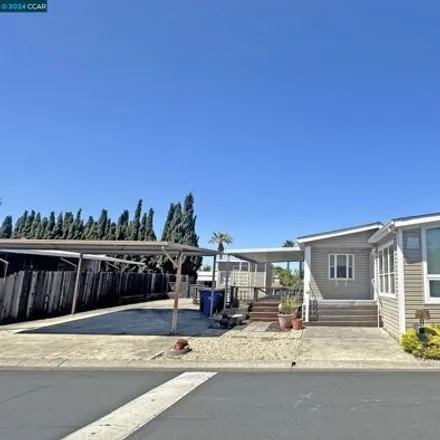
Wonderful opportunity to live in a conveniently located, gated community. This manufactured home features 2 bedrooms and 2 baths. When you walk into the home you are greeted by lots of windows and a large living room with a fireplace, dining area and...

$230,000
$230,000
Available: Right Now
Discover the cutest Manufactured Home in Carquinez Highlands MHP. This charming 3 bedroom 2 bathroom offers a perfect blend of comfort and convenience being located near Carquinez Bridge makes it great for commuters. The driveway will comfortably fit...

$429,000
$429,000
Available: Right Now
Adorable cottage offering simplicity and style. Craftsman vibes greet you as you enter the property with a picket fence wrapped front yard and covered porch. Refinished hardwood floors through entry to kitchen with new carpet and pad in living area. ...
$600,000
$600,000
Available: Right Now
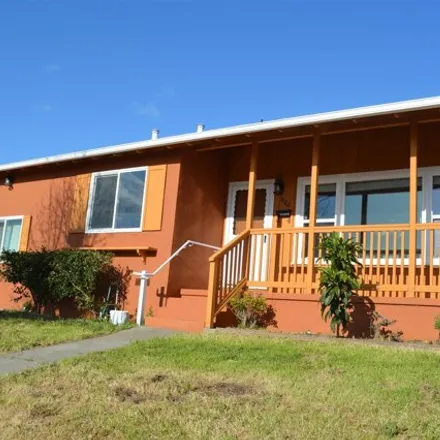
Nothing left undone in this 4 bedroom, 2 full bath single story home! Interior completely updated from new kitchen with quartz counters, new Thomasville cabinets, new appliances, new luxury vinyl flooring, new bathroom vanities, new carpet in bedroom...

$719,000
$719,000
Available: Right Now
Discover this charming home within the gated community of The Village, inspired by artist Thomas Kinkade. This cozy cottage-style residence features updated wide-plank hardwood flooring on the second floor and stairway. The gourmet kitchen boasts a 5...

$415,988
$415,988
Available: Right Now
This lovely home has 2 bedrooms and 2 bathrooms just waiting for your personal touch. The stunning and specious kitchen features granite countertops, a barn sink. The home offers an extra room with Washer and dyer included and has plantation-s...

$749,000
$749,000
Available: Right Now
Mare Island!!! 2, 496 Sq Ft of Living Space, 4 Beds 3 Baths 1 Bed and Full Bath Downstairs. This house is Featured on a Corner Lot with a 2 Minute Walk to Large Family Park (Its simply across the street) 4 Minute Walk to School its a Half Block Away!...

$600,000
$600,000
Available: Right Now
Welcome to our newest listing in Vallejo. This two-story home features 1785 sq ft of living space located on a large 4326 sq ft lot. You are greeted by a bright formal living room with vaulted ceilings, dining room, new paint, new carpets, an open ki...

$899,000
$899,000
Available: Right Now
This house Checks ALL the Boxes, Large flat VIEW lot, 3000+ square foot 1-story home, 5 bedrooms, 3 baths, Solar Panels, newer Furnace, newer A/C, Double-Pane Windows, Kitchen, Hardwood and laminate Floors, plenty of Storage. The flexible floorplan o...

$452,500
$452,500
Available: Right Now
Welcome to your dream home nestled in a gated complex just across the street from the serene waters of the Bay. This stunning two-story end unit offers the convenience of strolling to the nearby ferry, bus terminal, farmers market, and downtown dinin...
$770,000
$770,000
Available: Right Now
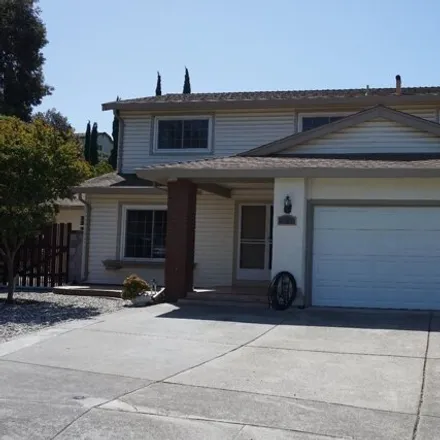
Welcome to your dream home! Private oasis nestled in serene court location. 5 bedrooms (including 2 primary suites with bathrooms and walk in closets. One of the primary suites on main floor with access to an incredible backyard. Perfect for entertai...

$845,000
$845,000
Available: Right Now
Spectacular, turn key home in The Village of Hiddenbrooke! The Village is the only gated enclave within the privately guarded community of Hiddenbrooke. For those seeking lock up and leave capability, additional peace of mind, and mindful xeriscape f...

$1,4M
$1,4M
Available: Right Now
Secluded rare find in Vallejo. This unique single story property features 3 bedrooms 3 bath 2300 Sqft, Lot is29, 615Sqft. Kitchen features Corian counter tops, triple sink, cherry wood cabinets and a nice open floor plan. Open beamed ceiling in livin...

$550,000
$550,000
Available: Right Now
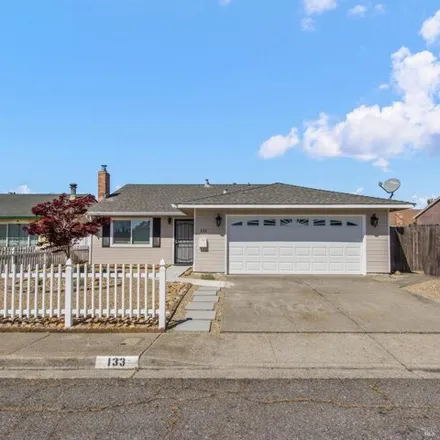
This Ridgewood Heights home with three bedrooms and two bathrooms has been tastefully remodeled and is now for sale! Arriving in style for the first time, this gem has belonged to the family since its construction 66 years ago! With its renovated flo...

$549,000
$549,000
Available: Right Now
Opportunity Knocks!! Here is a wonderful opportunity to own a wonderful and spacious home offering 3 spacious bedrooms, 2 full baths, hardwood flooring throughout, new white shaker cabinets with Quartz countertops, a large garage with an extra room f...

$499,999
$499,999
Available: Right Now
The seller is very motivated, presenting a fantastic opportunity to make this beautifully remodeled house your new home. Dont miss out on the chance to own this exceptional property at an incredible value. This beautifully remodeled residence is read...

$425,000
$425,000
Available: Right Now
Welcome to this single story 4 bedroom, 3 bathroom home that boasts over2, 000square feet of living space. Home needs some work and is ready for updating which provides the perfect opportunity to get an abundance of space for an affordable price. Spa...

$565,000
$565,000
Available: Right Now
Luxurious resort style, 3 bedrooms and 2.5 baths condo nestled in community of Belvedere in a Gated community, top floor, corner units with beautiful hills view, natural light and lot of privacy due to corner unit.This unit is one of the largest floo...

$680,000
$680,000
Available: Right Now
Welcome to your oasis in the Vista Neighborhood of Vallejo. Cool off from the summer heat with a great in ground crystal clear pool. Enjoy the evening on your private backyard deck. Plenty of room with a large 2 room suite downstairs, with room for a...

$759,000
$759,000
Available: Right Now
Welcome home to Dos Reis Quarter Acres, a rural setting next to Glen Cove. This home is ideal for a group home, or an extended household, or perhaps as an investment property for short-term rental to traveling nurses. Originally it was completed in 2...
Vallejo
According to statistics, the population in Vallejo, CA amounts to 120,599, which shows decline 1% compared to the previous year. The median age of the city’s residents is 38. The average household income is $62,272, shifting growth 4% from the past year, and the average property value in Vallejo, CA growth 16% to $295,600 throughout the year.
| Population | 120,599 |
| Median Age | 37.8 |
| Poverty Rate | 15% |
| Household Income | $62,272 |
| Number Of Employees | 54,877 |
| Median Property Value | $295,600 |
What is the Average Price of Apartments for Sale in Vallejo, CA?
| Month | Median Price |
|---|---|
| Jun 2024 |
$448,578
|
| May 2024 |
$430,574
|
| Apr 2024 |
$424,698
|
| Mar 2024 |
$424,698
|
| Feb 2024 |
$424,698
|
| Jan 2024 |
$424,698
|
| Month | Median Price |
|---|---|
| Jun 2024 |
$569,714
|
| May 2024 |
$566,567
|
| Apr 2024 |
$599,556
|
| Mar 2024 |
$599,556
|
| Feb 2024 |
$599,556
|
| Jan 2024 |
$599,556
|
Household Income
The average household income in Vallejo, CA grew from $59,600 to $62,272 in the past year. This data is an estimate based upon 41,642 households in Vallejo, CA . The chart below presents how household income is distributed in Vallejo, CA in comparison to the revenue allocation amid households nationally.
Property Value
According to data from last year, the average property value in Vallejo, CA shifted from $254,100 to $295,600 throughout the year. The subsequent graph indicates the share of properties in the given price range in Vallejo, CA in comparison to the median property value in the same price segment across the country. According to the data, the greatest share of Vallejo, CA properties falls in the '$300,000 to $399,999' range, which is higher than the most significant median property across the country.
Rent vs. Own
Property Taxes
One of the most important aspects for property owners is the amount of property taxes. This graph shows distribution of property taxes in Vallejo, CA compared to median property taxes around the country. The prevalent amount of property taxes in Vallejo, CA equals $3000, which is less than the national average.