San Francisco, CA, USA apartments for sale

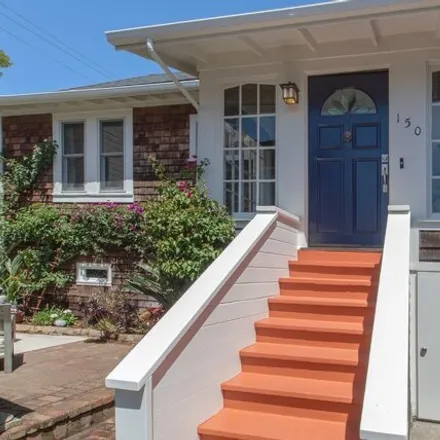
$1,25M
$1,25M
Available: Right Now
Welcome to Avalon Pines. A much sought after neighborhood. Great location on the Peninsula. A rare offering this one family owned home and shows the loving care, and how well it was maintained since it was built. The main living area has beautiful ne...
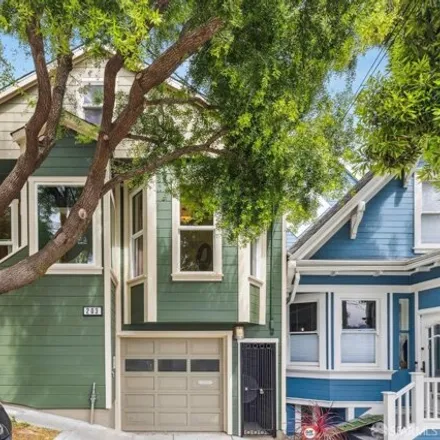
$1,38M
$1,38M
Available: Right Now
Discover the epitome of luxury townhouse living in this exquisite brand-new 4-bedroom, 3.5-bathroom property ideally located just about a mile away from both BART and Caltrain stations, ensuring a stress-free daily commute. With a modern design, lami...
$699,000
$699,000
Available: Right Now
Step into the best of city living at 240 Lombard St, Unit 939, nestled at the base of Telegraph Hill, Parc Telegraph is a hidden oasis in the North Waterfront. This recently updated light filled condo is one of the largest 1-bedroom units in the comm...
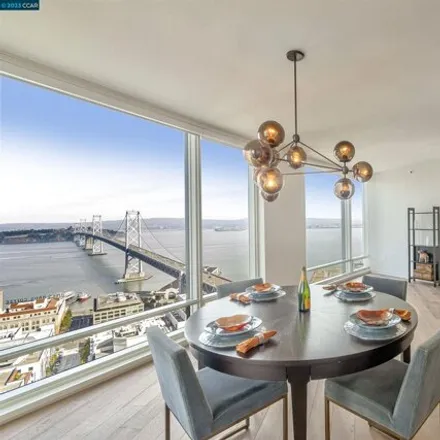
$2,29M
$2,29M
Available: Right Now
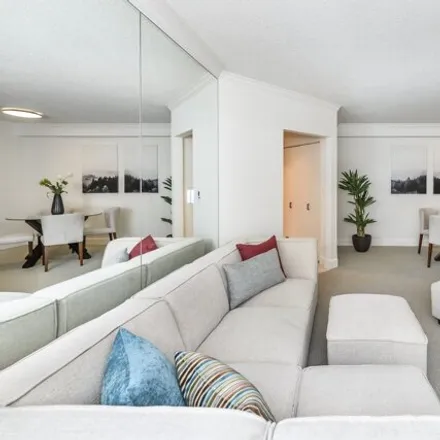
Don't miss this Opportunity to live in this Rarely available penthouse inNOB HILL' S gramercy towers with Unobstructed panoramic views from every room. BRIGHTand Spacious, this unit offers 3 bedrooms, 3 baths, 1893 ...
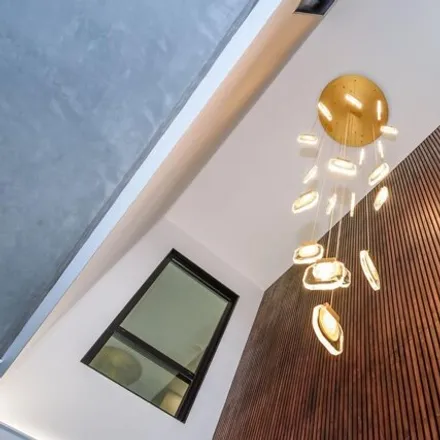
$2,75M
$2,75M
Available: Right Now
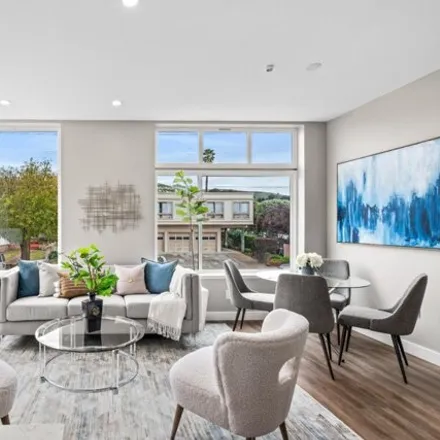
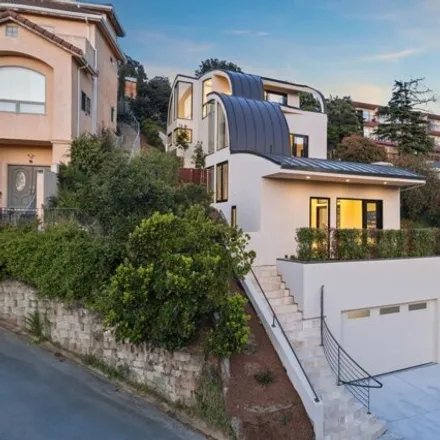
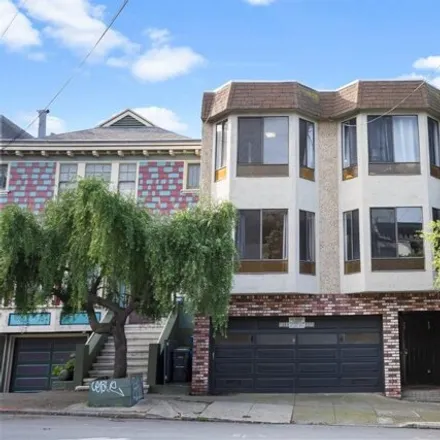
Discover modern luxury in this custom architectural masterpiece, a green home that harmoniously blends modern design, sustainability, and amazing views. This tri-level residence boasts 3 bedrooms, 2.5 baths with a 2-car garage and multiple view decks...
$13M
$13M
Available: Right Now
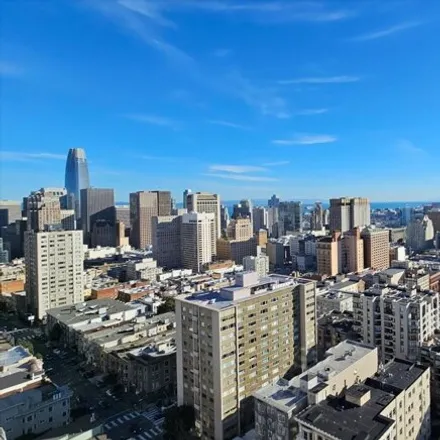
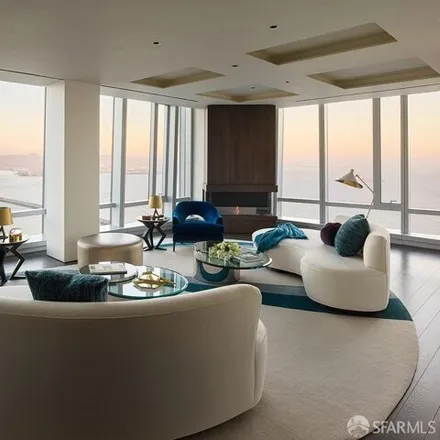
Step into the epitome of luxury living with this exquisite Half Floor Penthouse, now available at an enticing new price. Spanning an impressive3, 256square feet, this stunning residence boasts 2 bedrooms plus a media/den, 2.5 baths, and unrivaled vie...
$1,48M
$1,48M
Available: Right Now
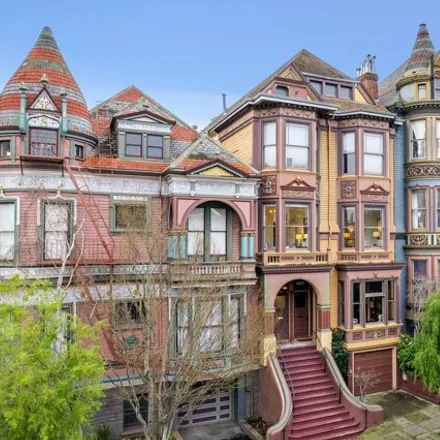
Nestled in the heart of San Francisco's Alamo Square, on the famed Seattle block, this elegant flat seamlessly marries timeless charm with contemporary comfort. With its high ceilings, original molding, ceiling medallions, and redwood trim, this spac...

$720,000
$720,000
Available: Right Now
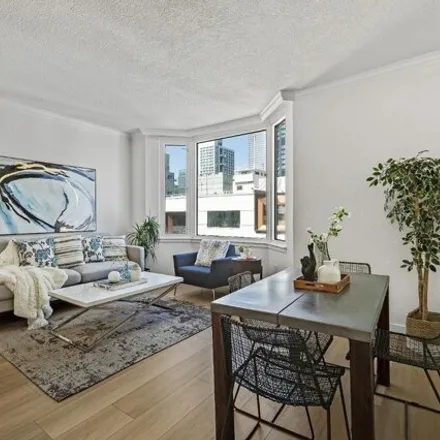
Welcome to luxury living on the top floor at The Palms! This contemporary highrise condo offers stunning city and landmark views including Twin Peaks and Sutro Tower, located in the heart of South Beach. This Penthouse level home features a sleek des...
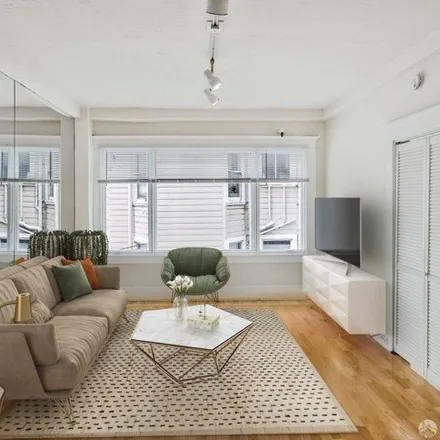
$1,2M
$1,2M
Available: Right Now
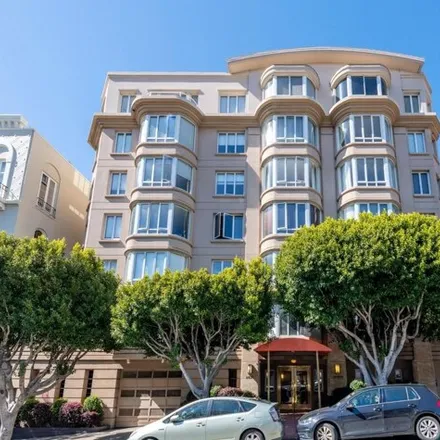
Welcome to 1438 Green Street, Unit 2C, a recently renovated 2-bed, 2-bath residence in San Francisco. This 1068 sq ft home features a contemporary open floor plan with gleaming hardwood floors, leading to a private deck with stunning bridge views. Th...
$2,1M
$2,1M
Available: Right Now
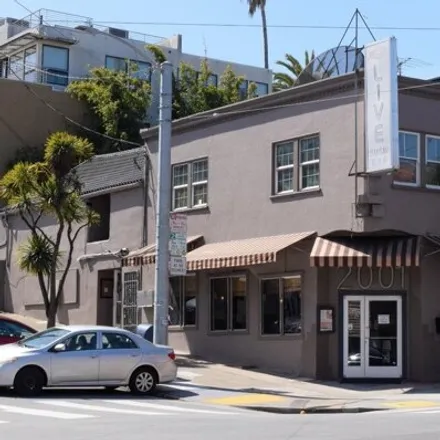
Marcus and Millichap is pleased to offer this unique investment opportunity in the rapidly growing Potrero Hill neighborhood. The second floor is currently vacant with an approved permit to build out a 4 bedroom and 2 bathroom single family home. The...
$2,4M
$2,4M
Available: Right Now
Discover this exquisite residence on the 31st floor of South Beach's prestigious luxury high-rise, The Harrison. 31C is a Ken Fulk-designed two-bedroom, two-bathroom luxury high-rise abode which offers splendid features and breathtaking vistas. Enjoy...

$1,39M
$1,39M
Available: Right Now
Discover an exquisite single-family home in the desirable Parkside neighborhood extensive remodeling completed in 2023. This 5 beds/3 baths residence offers modern elegance and comfortable living. A rare find with 3 beds/2 baths on upper level and 2 ...
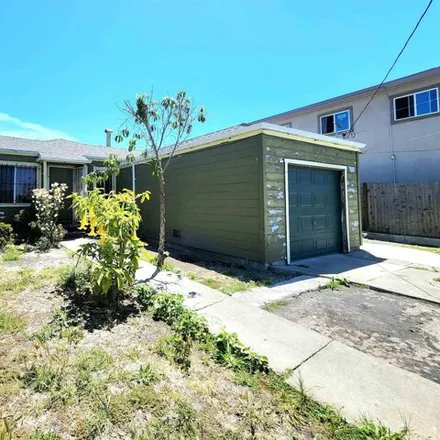
$445,000
$445,000
Available: Right Now
Welcome to 430 S 15th St, a fantastic fixer-upper bursting with potential. This property features a spacious yard perfect for gardening, outdoor activities, or expanding your living space. With ample room to build an Accessory Dwelling Unit (ADU), yo...
$1,4M
$1,4M
Available: Right Now
The rules of real estate are 'Location, location, location, ' and this home passes the test with flying colors. Live life in one of the City's most iconic and desirable neighborhoods, surrounded by the best of San Francisco's world-class charm. This ...
$497,000
$497,000
Available: Right Now
Opportunity for a first time home owner or for someone wanting a pied--terre/investment property! Come see this quiet one bedroom, one bath condominium with an abundance of natural light in a well maintained building. 2415 Van Ness is in a fantastic ...
$2,25M
$2,25M
Available: Right Now
Prime investment opportunity in the heart of Inner Sunset! Perfectly situated between shops and dining of Irving and Judah. 2 blocks from Golden Gate Park and steps from UCSF. This duplex consists of two large 3 bed 2 bath units with separate dining ...
$1,15M
$1,15M
Available: Right Now
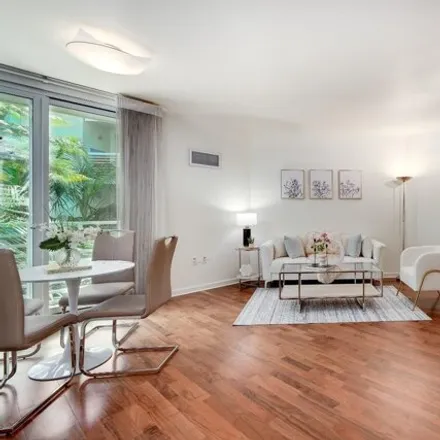
Stunning 2Br/2Ba residence, complete w a charming balcony and serene views of beautifully landscaped Palms garden. Enjoy the bright, spacious living room w custom lighting and newly-installed HW flooring, extending frm the guest to the master bedroom...
$450,000
$450,000
Available: Right Now
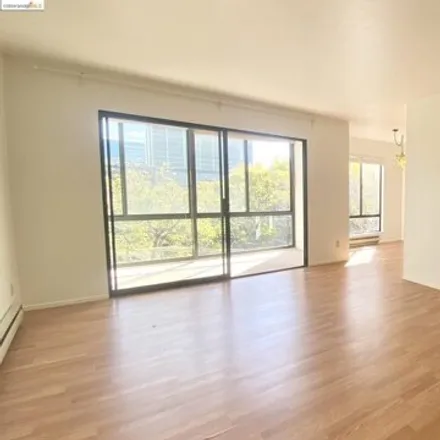
Here's a Top-Floor Large 1 Bedroom at Watergate. Wake up to the gentle morning sunlight in this inviting unit with an enclosed balcony, perfect to sip some coffee or work from home. Don't hesitate to take advantage of the large walk-in closet off of ...
$779,000
$779,000
Available: Right Now
Be the first to enjoy this fully renovated waterfront condo with great views of the Bay Bridge and the city skyline. This is a corner 2 bed, 2 bath unit with new hardwood floors, newly renovated kitchen and bathrooms, new appliances and fresh paint t...
$685,000
$685,000
Available: Right Now
Spacious and bright home overlooking the tranquil Garden Courtyard. Inside, a large chef inspire kitchen with premium appliances, LVP in living and kitchen areas, solid wood corrugated barn door, recessed lighting on dimmers, 20 wall-surround tile li...
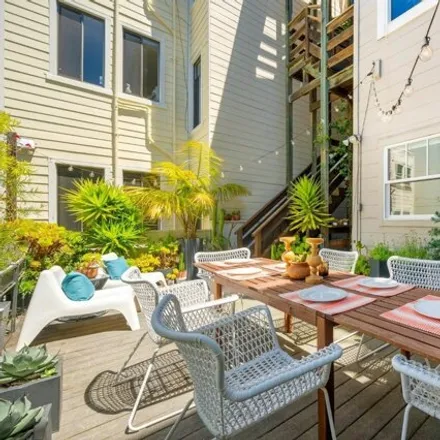
$1,5M
$1,5M
Available: Right Now
Welcome to this extensively renovated home that is both sophisticated and inviting. It offers 3 bedrooms, 2-1/2bathrooms, pkg for one car and a charming walkout garden. The heart of this home is the open-format living/dining/kitchen area with high ce...
$699,000
$699,000
Available: Right Now
Tucked away from the street is this bright wood-shingled cottage with pretty garden and patio. Light streams into the open living/dining/kitchen with high ceilings, windows on three sides and outlooks of Mt. Diablo and the East Bay hills. The bedroom...
San Francisco
According to statistics, the population in San Francisco, CA amounts to 883,305, which shows decline 0% compared to the previous year. The median age of the city’s residents is 38. The average household income is $112,376, shifting growth 1% from the past year, and the average property value in San Francisco, CA growth 8% to $1,195,700 throughout the year.
| Population | 883,305 |
| Median Age | 38.3 |
| Poverty Rate | 12% |
| Household Income | $112,376 |
| Number Of Employees | 536,653 |
| Median Property Value | $1,195,700 |
What is the Average Price of Apartments for Sale in San Francisco, CA?
| Month | Median Price |
|---|---|
| Jun 2024 |
$788,282
|
| May 2024 |
$805,279
|
| Apr 2024 |
$936,525
|
| Mar 2024 |
$936,525
|
| Feb 2024 |
$936,525
|
| Jan 2024 |
$936,525
|
| Month | Median Price |
|---|---|
| Jun 2024 |
$1,954,712
|
| May 2024 |
$1,988,105
|
| Apr 2024 |
$1,834,822
|
| Mar 2024 |
$1,677,499
|
| Feb 2024 |
$1,677,499
|
| Jan 2024 |
$1,677,499
|
Household Income
The average household income in San Francisco, CA grew from $110,816 to $112,376 in the past year. This data is an estimate based upon 362,827 households in San Francisco, CA . The chart below presents how household income is distributed in San Francisco, CA in comparison to the revenue allocation amid households nationally.
Property Value
According to data from last year, the average property value in San Francisco, CA shifted from $1,104,100 to $1,195,700 throughout the year. The subsequent graph indicates the share of properties in the given price range in San Francisco, CA in comparison to the median property value in the same price segment across the country. According to the data, the greatest share of San Francisco, CA properties falls in the '$1,000,000 to $1,499,999' range, which is higher than the most significant median property across the country.
Rent vs. Own
Property Taxes
One of the most important aspects for property owners is the amount of property taxes. This graph shows distribution of property taxes in San Francisco, CA compared to median property taxes around the country. The prevalent amount of property taxes in San Francisco, CA equals $3000, which is less than the national average.