Fremont, CA, USA apartments for sale

$3,8M
$3,8M
Available: Right Now
7.9 Acre Mission San Jose Hilltop Mid-Century Estate within 1 exit of Mission Blvd at 680! Conveniently located within 3 miles of top rated Mission San Jose Schools and under 25 miles from Apple Park, Googleplex and Facebook HQ, you can unwind at thi...

$1,6M
$1,6M
Available: Right Now
Coming Soon Sneak preview Open House Sa/Su 7/6 and7/7 1:30to 3:30. The most beautiful high-end remodel in Ardenwood. 3 great schools. Rare private entry. It 'lives' like a single family home. Most versatile floorplan, 1 bdrm and 1 full bth dow...
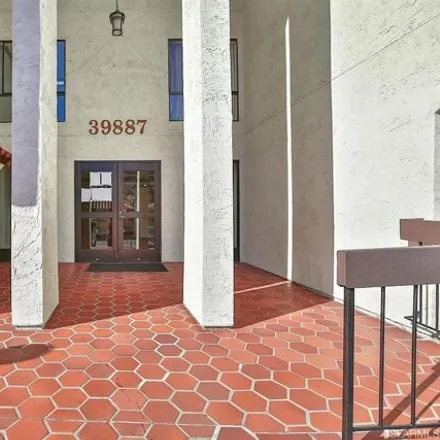
$630,000
$630,000
Available: Right Now
Most Desirable Murieta Community Condo. This is the perfect starter home, located in the Newpark Mall-Mowry neighborhood, and has been well maintained. Featuring double vanities in the master bath, and an updated kitchen with granite counters and a s...

$1,7M
$1,7M
Available: Right Now
Immerse yourself in this beautifully remodeled home in the highly desired Willows Neighborhood of Menlo Park, or simply relax in the hammock and enjoy the gorgeous rose and hydrangea garden oasis. This lovely 2 bedroom 1 bath property is also located...

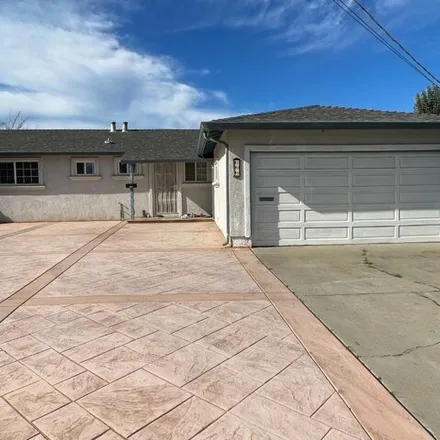
$1,38M
$1,38M
Available: Right Now
Remodeled single story home with laminate flooring throughout, recessed lights, dual pane windows. This home has 3 spacious bedrooms, two bathrooms, two car garage w/ two 220 volt EV charger outlets and a big nice backyard to build a ADU, with high q...
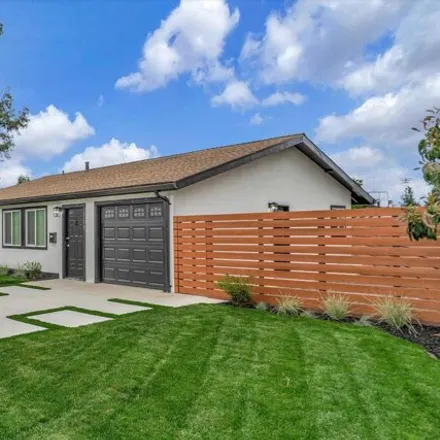
$1,15M
$1,15M
Available: Right Now
Be the first to live in this beautifully remodeled 3 bedroom, 2 bathroom home! Enjoy making and sharing meals together in the carefully curated kitchen. Outdoor summers will not disappoint in the backyard. So many memories to make as a family in this...

$1,69M
$1,69M
Available: Right Now
Completely remodeled home with Permit using top quality material. New kitchen with highend appliances and induction stove (gas option is also available) and designer cabinets, built in microwave, extra large island, plus tons of storage. Luxurious ma...

$1,08M
$1,08M
Available: Right Now
Stunning contemporary end unit townhouse style condo built by Tri-Pointe Homes in 2016 Low Montly HOA only $190 per month This luxurious property offers 2 en-suite bedrooms, 2-1/2bathrooms, plus an open air balcony Open floor plan offers large kitche...

$1,49M
$1,49M
Available: Right Now
Stunning fully remodeled 3-bedrooms, 2-bathrooms home. Features, New flooring throughout, New painting interior, exterior, New Cabinets/ Counter Tops, New Appliances, New bathrooms, including plumbing, recess lights in all rooms, New Insulation in At...

$1,64M
$1,64M
Available: Right Now
Fantastic opportunity! This 4 bedroom and 3 full bath home with 1841 square feet of living space, plus a 285 square foot sun room is available for the first time in 2 generations. This home has a pool/spa combo, rv/boat parking on a large7, 040square...
$1,2M
$1,2M
Available: Right Now
This single story home boasts 3 beds, 2 baths with huge lot size (almost 9K sq ft) for a potential ADU or additional living space. It sits on one of the largest lots in the neighborhood, giving the new homeowner many possibilities. Front yard is spac...

$1,35M
$1,35M
Available: Right Now
Welcome to this spacious and beautifully remodeled home in a wonderful Newark neighborhood. This property features a spacious open-concept layout, perfect for modern living. The heart of the home is the huge chefs kitchen with two large islands, offe...

$674,950
$674,950
Available: Right Now
Located in the highly desirable sought-after in the Warm Spring District of Fremont. Beautiful bright end unit features two spacious bedrooms with two full baths. Vaulted ceiling in Livingroom and in both Bedrooms. The Master suite has two closets an...

$1,58M
$1,58M
Available: Right Now
First and foremost, this Beautiful Ranch Style Home is a Treasure found for a large loving family or 2 families, 5/6 BRs, and 4 full Bathrooms at a bargain value. It also has the possibility of being a Care Home or converted into 2 separate living un...

$2,5M
$2,5M
Available: Right Now
A prime commercial mix building located in the heart of Fremont's vibrant district. This versatile property boasts a thriving restaurant that generates a substantial monthly income. In addition to the restaurant, the property includes residential uni...

$1,25M
$1,25M
Available: Right Now
This exquisite corner unit spans three spacious levels, offering a perfect blend of modern elegance and functional design. Updated with fresh paint throughout and new carpet installed. The lower level includes a bedroom and bathroom plus a direct acc...

$415,000
$415,000
Available: Right Now
Well maintained and recently updated 1 bedroom / 1 bath condo located in a quiet neighborhood and conveniently located to shops, restaurants. Spacious open kitchen/family room combo and dining nook area. Updated in2021 -waterproof laminate floors thr...

$1,49M
$1,49M
Available: Right Now
Opportunities like this are rare and highly sought after by savvy investors! This unique property features four separate houses on a spacious lot of approximately16, 113sq ft, with potential for further development. Three of the homes each have 2 bed...

$1,29M
$1,29M
Available: Right Now
Gorgeous East-facing 3-bedroom, 2.5-bathroom, 2-story townhome nestled in the prestigious Liberty Commons community. This move-in-ready gem is located in a secure gated community. Home is well lit with a lot of natural light streaming through large w...

$739,000
$739,000
Available: Right Now
No Rental Restrictions, low HOA fees and High in Demand rental community!! This awesome North-East facing ground floor 2 Bed 2 Bath 2 parking residence is perfectly suited for living in, investment or senior living. Located in the highly sought after...

$384,900
$384,900
Available: Right Now
Beautiful family park for all age, 3 bedroom, 2 bath manufactured home. 7 years young. First owner, Kept well just like New Home, Open floorplan. Light and bright. Freshly painted exterior and interior. Newly Carpet floors. Large family room and sepa...

$1,48M
$1,48M
Available: Right Now
Great opportunity to own in a highly desirable Seven Hills and Mission Peak Foothills neighborhood. area. Located in the prime location of the seven hills community and the Mission Peak Foothills neighborhood. split level home. for the large family, ...
Fremont
According to statistics, the population in Fremont, CA amounts to 230,964, which shows growth 1% compared to the previous year. The median age of the city’s residents is 38. The average household income is $122,191, shifting growth 9% from the past year, and the average property value in Fremont, CA growth 12% to $785,700 throughout the year.
| Population | 230,964 |
| Median Age | 37.7 |
| Poverty Rate | 5% |
| Household Income | $122,191 |
| Number Of Employees | 116,110 |
| Median Property Value | $785,700 |
What is the Average Price of Apartments for Sale in Fremont, CA?
| Month | Median Price |
|---|---|
| Jun 2024 |
$681,567
|
| May 2024 |
$699,889
|
| Apr 2024 |
$638,116
|
| Mar 2024 |
$638,116
|
| Feb 2024 |
$638,116
|
| Jan 2024 |
$638,116
|
| Month | Median Price |
|---|---|
| Jun 2024 |
$1,197,852
|
| May 2024 |
$1,261,102
|
| Apr 2024 |
$1,009,150
|
| Mar 2024 |
$1,346,433
|
| Feb 2024 |
$1,346,433
|
| Jan 2024 |
$1,346,433
|
Household Income
The average household income in Fremont, CA grew from $111,613 to $122,191 in the past year. This data is an estimate based upon 73,617 households in Fremont, CA . The chart below presents how household income is distributed in Fremont, CA in comparison to the revenue allocation amid households nationally.
Property Value
According to data from last year, the average property value in Fremont, CA shifted from $702,800 to $785,700 throughout the year. The subsequent graph indicates the share of properties in the given price range in Fremont, CA in comparison to the median property value in the same price segment across the country. According to the data, the greatest share of Fremont, CA properties falls in the '$500,000 to $749,999' range, which is higher than the most significant median property across the country.
Rent vs. Own
Property Taxes
One of the most important aspects for property owners is the amount of property taxes. This graph shows distribution of property taxes in Fremont, CA compared to median property taxes around the country. The prevalent amount of property taxes in Fremont, CA equals $3000, which is less than the national average.