Hayward, CA, USA apartments for sale
$4,25M
$4,25M
Available: Right Now
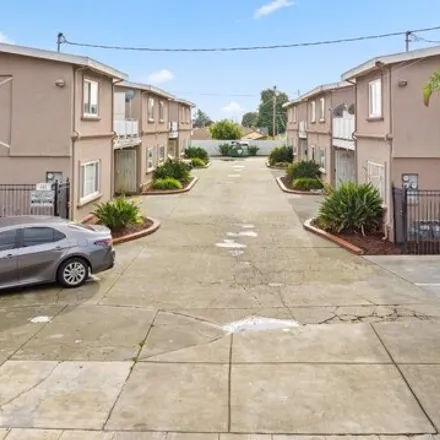
Your opportunity to own an amazing 10 unit townhome complex in the heart of the Bay Area. Conveniently located in a residential neighborhood just 5 minutes from downtown. Situated on a22, 849sqft parcel, The subject properties were built in 1964 then...
$1,29M
$1,29M
Available: Right Now
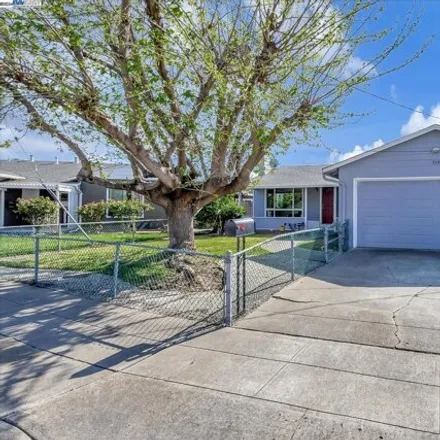
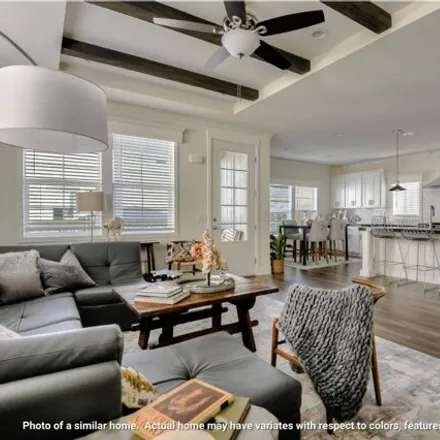
Come see this spacious home conveniently located in the desirable Cabrillo neighborhood in the city of Fremont. The floor plan is smartly divided between living area and bedroom wing for comfort living. Contemporary touches include LVT flooring, fres...
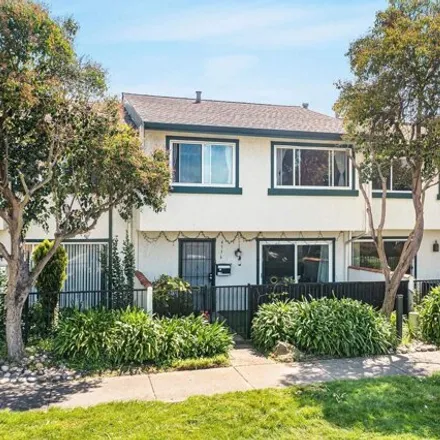
$779,950
$779,950
Available: Right Now
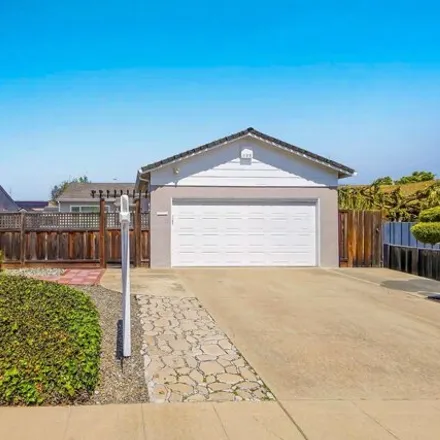
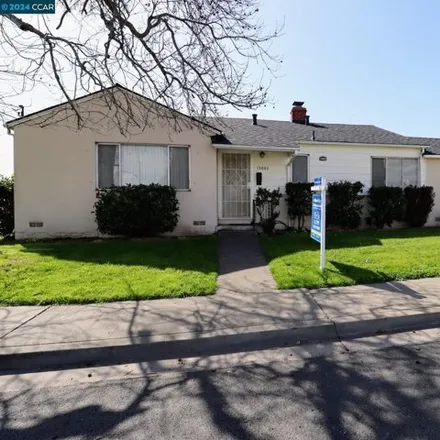
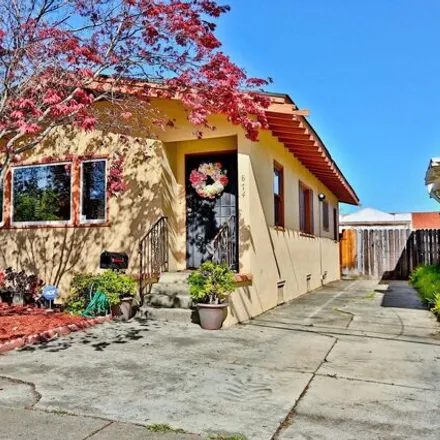
Welcome to this charming 3-bedroom, 2-bathroom home nestled in a serene neighborhood. As you step inside, youre greeted by a well sized living room featuring original hardwood flooring under the carpet which continues throughout the hallways and bedr...
$399,000
$399,000
Available: Right Now
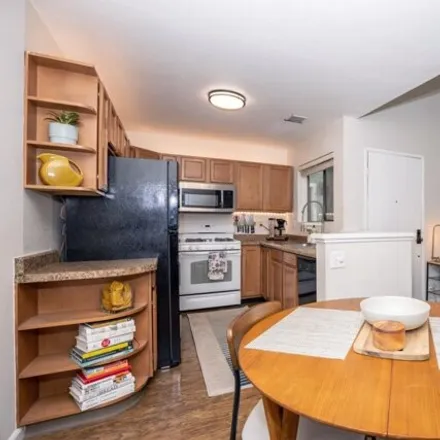
Light and airy top-floor condo with vaulted ceilings and wood laminate flooring. Open floorplan with kitchen, living room and dining area. Updated kitchen with wood cabinets. Updated bathroom with shower/tub and tile floors. Assigned carport parking ...
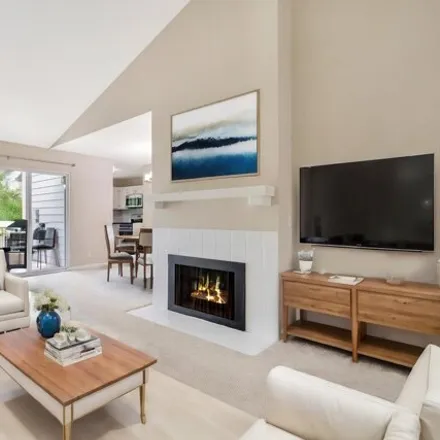
$869,950
$869,950
Available: Right Now
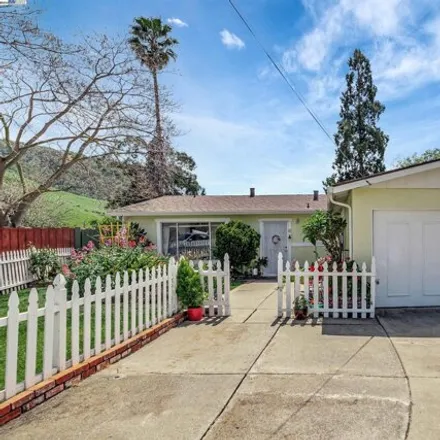
Welcome to your dream home nestled in the heart of The San Lorenzo Village! This charming single-family residence boasts 3 cozy bedrooms and 2 bathrooms, all w/in a spacious1, 181Sq/Ft of living space. Plank hardwood floors guide you through the ligh...
$509,000
$509,000
Available: Right Now
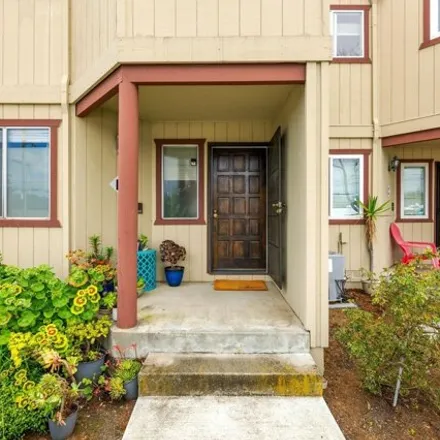
Step into this newly revitalized townhome-style condo, boasting freshly painted interiors that exude modern elegance. This move-in ready gem spans across two stories, offering 2 Beds, 1.5 baths, and 1101 square feet of stylish living space. Perfectly...
$1,68M
$1,68M
Available: Right Now
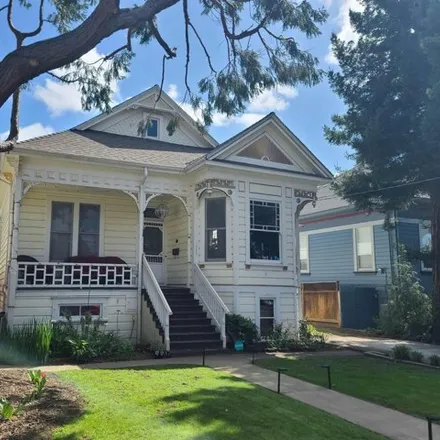
This property is two buildings on one large lot. Check with the city of Hayward regarding a possible lot split, creating two separate saleable dwellings. Buyer to verify. Building #1 is 1356 Valley St. which is a Triplex. Unit 1356 is an upstairs apa...
$1,8M
$1,8M
Available: Right Now
This one of a kind2, 673sq ft, 3 bed, 2 bath home is situated on an Amazing 1.4 acre sprawling gated lot w/beautiful views. Once inside the front door you will see a lush planted glass enclosed atrium, formal living room w/vaulted wood ceiling, floor...
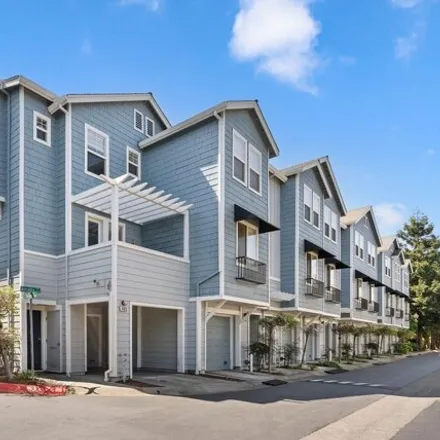
$909,800
$909,800
Available: Right Now
Spacious and remodeled 4 bedroom, 2.5 bath townhome in Union City. Large, open kitchen with granite counters, stainless steel appliances. Inside laundry room/pantry. All bathrooms updated. Updated flooring throughout, crown molding, dual-pane windows...
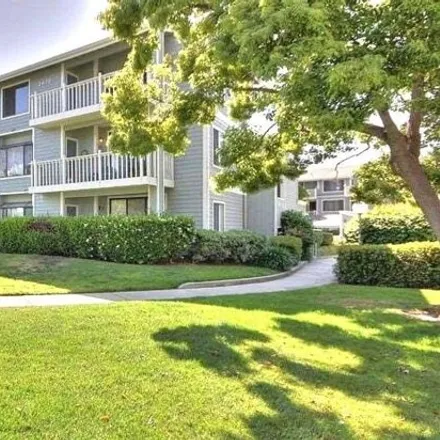
$595,000
$595,000
Available: Right Now
Tucked into the gated Meadowbrook community is a gorgeous penthouse condo loaded with upgrades! Luxurious vaulted ceilings and an open floor plan allow for a light and bright atmosphere! Beautifully remodeled kitchen has stone counters, tile backspla...
$1,15M
$1,15M
Available: Right Now
Beautiful home in San Leandro Manor district. 2251 square feet with 5 bedrooms and 3 bathrooms in a waterfront community. Large villa with reasonable and comfortable layout, simple decoration, durable, elegant, not fancy. Located in the Heron Bay com...
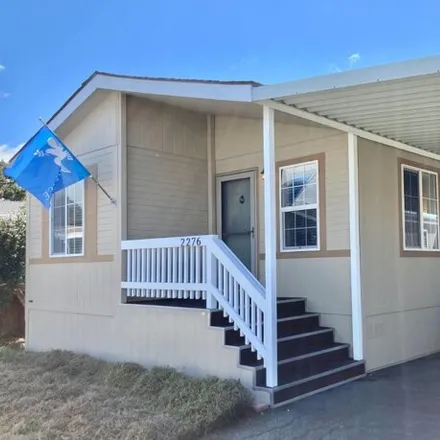
$329,000
$329,000
Available: Right Now
New to market! Sparkling 2 Bed 2 Bath in Hayward's desirable Edon Roc Mobile Park. This home features vaulted ceilings, with living areas of light laminated flooring. A sunny kitchen has all stainless appliances and ample cabinets and storage. Master...
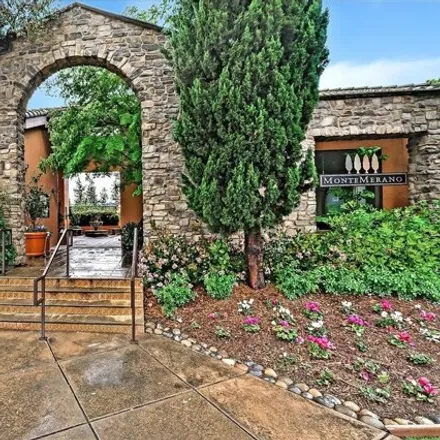
$449,000
$449,000
Available: Right Now
A GEM in central FremontMUST SEE! Must have ! Beautiful 1 bedroom and 1 bathroom condo is located in highly desirable and prestigious gated community, Monte Merano, which provides some best amenities in Fremont: well-maintained heated large sw...
$675,000
$675,000
Available: Right Now
Welcome to 663 Arcadia Dr.! This exceptional 2-bed, 2.5-bath 1179sqft end unit townhome in the highly desired Grand Terrace Community awaits your arrival! Perfectly located near BART, downtown, the library, farmers market, movie theater and restauran...
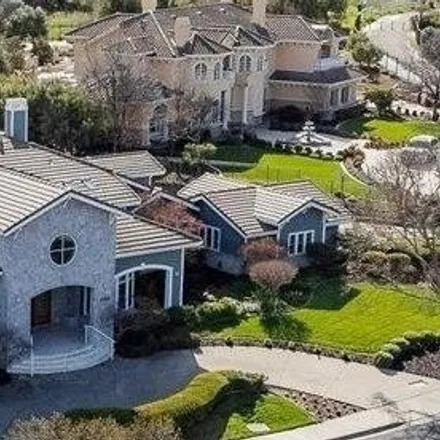
$5,25M
$5,25M
Available: Right Now
Luxury living on the Foothill Mountains at the Moller Ranch Estates in Pleasanton. Gorgeous two story custom home situated on a premium.74 acre lot. Boasting 5 bedrooms + office + bonus room, 4.5 baths and 4-car garage. This residence spans4, 924sqft...
$589,989
$589,989
Available: Right Now
Experience luxury in this exceptional 2-bed, 2-bath condo nestled in the coveted Meadow Brook Village community at the heart of Fremont. Flooded with natural light, this home features a contemporary kitchen boasting sleek stainless steel appliances, ...
$725,000
$725,000
Available: Right Now
Welcome to your new home in the desirable neighborhood of Cherryland! This charming bungalow boasts a cozy yet spacious layout featuring 2 bedrooms and 1 bathroom, perfect for a small family or those seeking a quaint retreat. Step inside to discover ...
$1,25M
$1,25M
Available: Right Now
Work in the City live in the Country! A great place to call home! Windows, Windows, Windows. Nestled in the Beautiful hills of Niles Canyon in Canyon Heights. Views of the Hills, Bay, bridges. Nice lot, possible expansion or ADU addition. Natural lig...
$2,4M
$2,4M
Available: Right Now
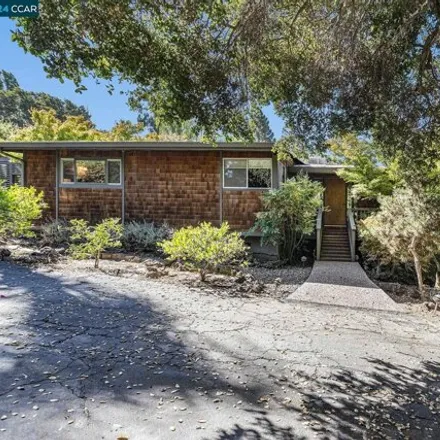
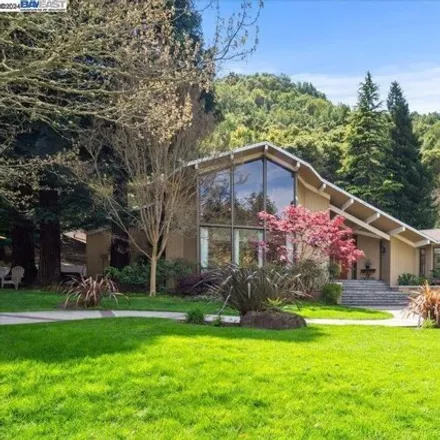
Serenity abounds in this picturesque canyon property on historic Palomares Creek, Castro Valley. With acreage and stunning natural surroundings, this is the perfect setting for your forever home. A spectacular architectural masterpiece awaits you ami...

$308,800
$308,800
Available: Right Now
Newer manufactured 3 bedroom, plus a den, 2 bath home in the desirable Mission Bay community. Freshly painted interior and exterior. New flooring thru out. Living room with vaulted ceilings open to the dine area and kitchen. Breakfast area in the kit...
$439,000
$439,000
Available: Right Now
A world apart from the hustle and bustle of city life, this beautiful 3 bedroom, 3 bathroom home offers superb amenities with every detail precisely designed to create an elegant yet comfortable environment. Nestled on a spacious lot in the family co...
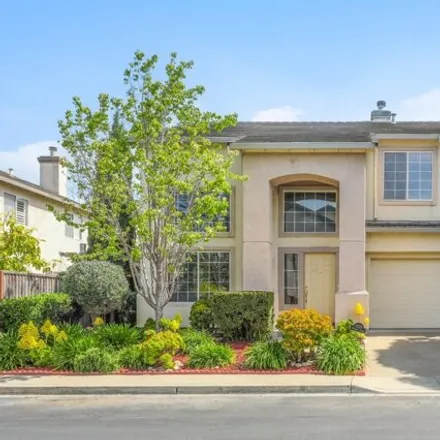
$908,000
$908,000
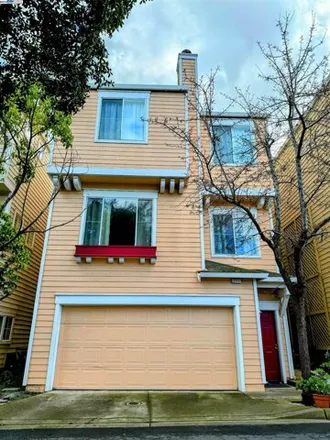
Available: Right Now
Discover the perfect blend of comfort and potential at 2111 Brandywine Place, Hayward a distinctive treasure nestled in the serene Hayward Hills. Offered at$908, 000,this detached 3-story home delivers an exceptional living experience within a cozy c...
Hayward
According to statistics, the population in Hayward, CA amounts to 156,917, which shows growth 2% compared to the previous year. The median age of the city’s residents is 35. The average household income is $74,927, shifting growth 10% from the past year, and the average property value in Hayward, CA growth 14% to $462,000 throughout the year.
| Population | 156,917 |
| Median Age | 34.9 |
| Poverty Rate | 11% |
| Household Income | $74,927 |
| Number Of Employees | 79,470 |
| Median Property Value | $462,000 |
Household Income
The average household income in Hayward, CA grew from $68,138 to $74,927 in the past year. This data is an estimate based upon 47,044 households in Hayward, CA . The chart below presents how household income is distributed in Hayward, CA in comparison to the revenue allocation amid households nationally.
Property Value
According to data from last year, the average property value in Hayward, CA shifted from $404,500 to $462,000 throughout the year. The subsequent graph indicates the share of properties in the given price range in Hayward, CA in comparison to the median property value in the same price segment across the country. According to the data, the greatest share of Hayward, CA properties falls in the '$500,000 to $749,999' range, which is higher than the most significant median property across the country.
Rent vs. Own
Property Taxes
One of the most important aspects for property owners is the amount of property taxes. This graph shows distribution of property taxes in Hayward, CA compared to median property taxes around the country. The prevalent amount of property taxes in Hayward, CA equals $3000, which is less than the national average.