Union City, CA, USA apartments for sale

$1,83M
$1,83M
Available: Right Now
Welcome to 35011 Mount Palomar Ct, a stunning home nestled in the heart of Fremont, CA. This beautifully maintained property offers a perfect blend of comfort, style, and convenience, making it an ideal choice for discerning buyers. The home offers 4...
$499,500
$499,500
Available: Right Now
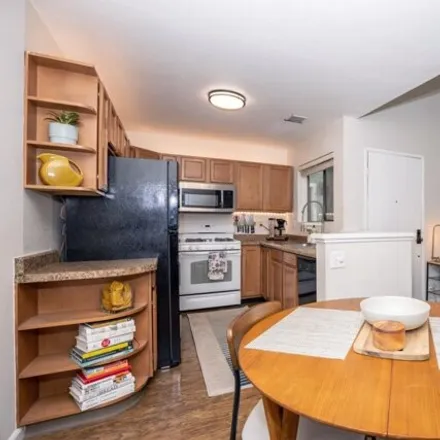
Modern and bright end-unit is move-in ready! This 2nd floor condo features tile and laminate floors w/ LED recessed lighting and ceiling fans throughout, gas fireplace, and in unit laundry. Kitchen upgrades include granite counters, refrigerator, gas...

$2,99M
$2,99M
Available: Right Now
Welcome to this beautifully designed North East facing executive home in the coveted Patterson Ranch development of North Fremont. The light-filled open floorplan w/ high ceilings features a large formal living room and dining room with dramatic high...
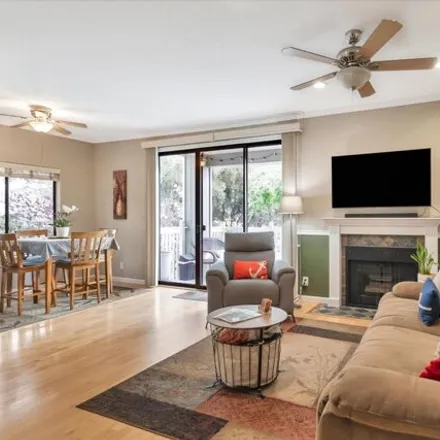
$679,800
$679,800
Available: Right Now
Fabulous Villa Style Condo in the Monte Vista community! Spacious floor plan with no one above you. Fantastic location view of the mountains and pool. Gourmet kitchen to prep those delicious food. All appliances stay. New vinyl tile floor and wall-to...
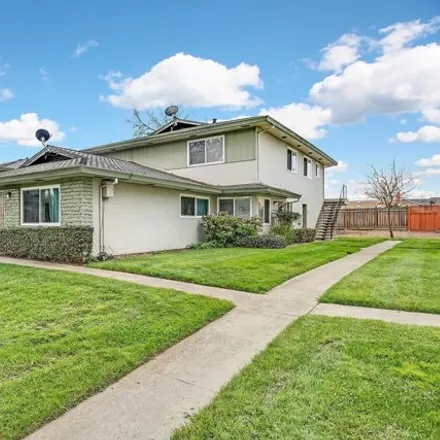
$529,950
$529,950
Available: Right Now
This second floor condo is very spacious and includes some nice upgrades that include vinyl windows, laminate floors and solid surface counter top in the kitchen. Its close to shopping, Quarry Lake Regional Park and is a great commuter location since...

$320,000
$320,000
Available: Right Now
Super cozy Fleetwood manufacture home with Whirlpool Appliances. 3 bedrooms, 2 bathrooms. Refrigerator, washer/dryer are included. Brand new microwave. Sun tunnel skylights. Toilets come with Uspa toilet bidets. Spacious primary bedroom suite w/walk-...

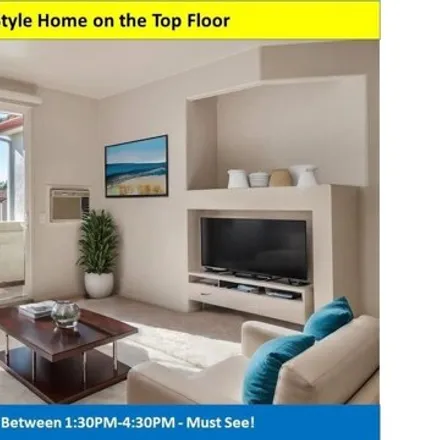
$689,000
$689,000
Available: Right Now
Welcome to the Monta Vista community of Union City featuring two bedrooms and two bathrooms spanning over1, 023sqft. of living space. The ground level condo with attached garage makes you feel right at home with an open living concept with high ceili...
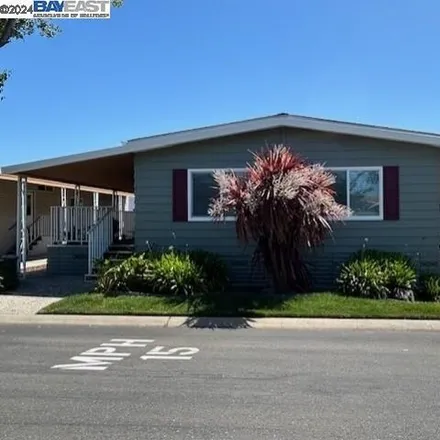
$325,000
$325,000
Available: Right Now
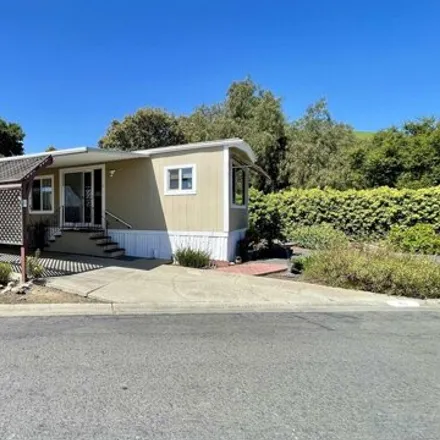
Wow! Check out this beautifully updated mobile home in New England Village. This lovely property features; 2 bedrooms; 2 full baths; kitchen with upgraded cabinets, granite counter tops, including breakfast bar, stainless steel appliances, and panty;...
$1,5M
$1,5M
Available: Right Now
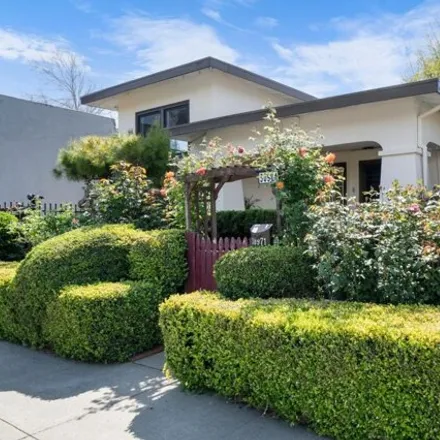
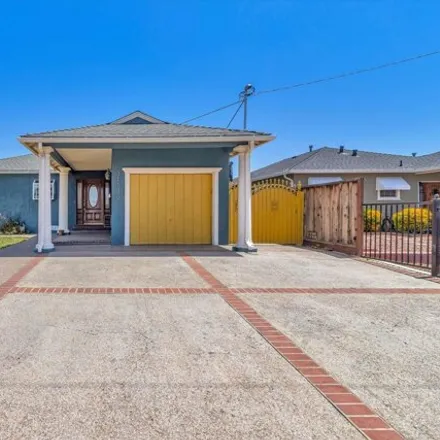
Beautiful historical house in downtown Union City, with ADU, total 2271 living sqft, 5 bedrooms and 4 baths, two of the bedrooms are suites. Completely renovated since 2018: chefs kitchen boasting granite countertops, plenty of designer cabinets, sta...

$1,4M
$1,4M
Available: Right Now
Don't miss out on the opportunity of this delightful home nestled in the sought-after Willowcreek neighborhood! Located just across from Sugar Mill Park, this home offers fantastic value. Inside, you'll find a thoughtfully designed floor plan featuri...
$1,6M
$1,6M
Available: Right Now
Location Location Location!!! corner lot located on smith street walking distance to all amenities at Union Landing Walmart, Gym, banks, groceries, cinema, Minutes away hayward Costco, 84 freeway 880 freeway and a lot more possibilities with 17100 sq...

$1,85M
$1,85M
Available: Right Now
This beautiful single-story home is nestled in one of the most sought-after neighborhoods in Fremont. The property boasts high vaulted ceilings, three spacious bedrooms, and two bathrooms. Meticulously taken care of and upgraded throughout the years,...

$1,9M
$1,9M
Available: Right Now
Welcome to your dream home! Original owners has meticulously maintained this single family residential home in a highly desirable Union City neighborhood, boasts 4 spacious bedrooms and 2.5 bathrooms across2, 139square feet of living space. Home is i...
$6,9M
$6,9M
Available: Right Now
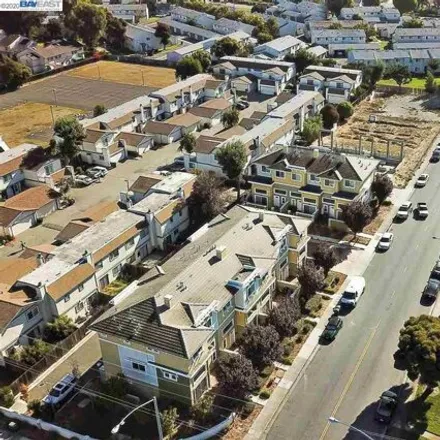
Incredible Opportunity to own 7 Cash Flowing Townhomes! Each has 3 bedrooms, 2.5 Baths, 1566 sqft and a 2 car garage. On the same lot, flat building site for 9 additional townhomes. Cash flow opportunity, while building out. Potentially 16 Cashflowin...
$850,000
$850,000
Available: Right Now
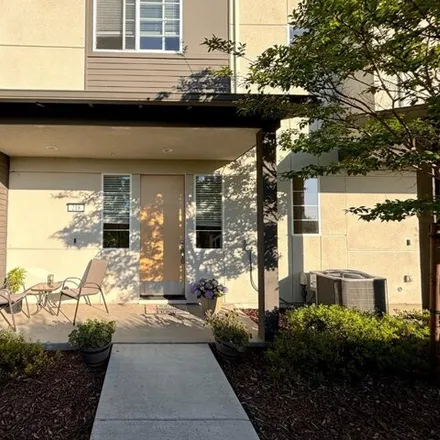
Experience the comfort and convenience of this lovely three-level townhome-style condominium nestled in a vibrant community! As you enter, you'll appreciate the practicality of the formal foyer/mudroom, providing easy access to the 2-car garage on th...

$639,900
$639,900
Available: Right Now
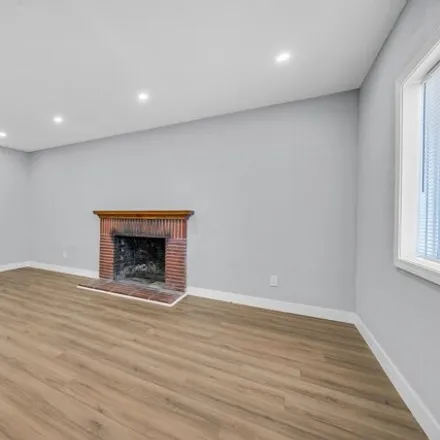
Nicely updated condominium offering three bedrooms and two bathrooms. Spacious living room with newer laminate flooring, wood burning fireplace and sliding door out to the fenced back patio, great for relaxing and entertaining. Upgraded kitchen with ...

$415,000
$415,000
Available: Right Now
Well maintained and recently updated 1 bedroom / 1 bath condo located in a quiet neighborhood and conveniently located to shops, restaurants. Spacious open kitchen/family room combo and dining nook area. Updated in2021 -waterproof laminate floors thr...

$1,28M
$1,28M
Available: Right Now
Discover Refined Living in this Recently Renovated 3 Bedroom, 2 Bath 1-Story Single-Family Home Nestled in Union City's serene Regency Park neighborhood. Spanning about1, 357sqft of Living Space, this home offers ample room for comfort and style. The...
$749,999
$749,999
Available: Right Now
Great Value! This charming 3 bed, 1 bath, 1, 013square foot home located in Hayward would be ideal for you and your family. This lovely home was built in 1951. Enjoy the top schools associated with this fabulous home. Gather with family and friends i...
$124,999
$124,999
Available: Right Now
55+ Senior Community! This charming updated 1 bed, 1 bath, 588 square foot mobile home in Niles Canyon welcomes you with open arms. Step inside and be greeted by the elegance of laminated vinyl planks that grace the floors, offering style and durabil...

$2,6M
$2,6M
Available: Right Now
Stunning 2 story home, nestled near foothills in desirable Millwood neighborhood of Fremont, voted best city to raise a family! Features step-down living room w/vaulted ceiling; elegant formal dining room; beautiful kitchen w/custom cabinets, granite...
$399,000
$399,000
Available: Right Now
Light and airy top-floor condo with vaulted ceilings and wood laminate flooring. Open floorplan with kitchen, living room and dining area. Updated kitchen with wood cabinets. Updated bathroom with shower/tub and tile floors. Assigned carport parking ...
Union City
According to statistics, the population in Union City, CA amounts to 74,354, which shows growth 1% compared to the previous year. The median age of the city’s residents is 38. The average household income is $95,625, shifting growth 4% from the past year, and the average property value in Union City, CA growth 11% to $620,200 throughout the year.
| Population | 74,354 |
| Median Age | 38.2 |
| Poverty Rate | 7% |
| Household Income | $95,625 |
| Number Of Employees | 36,891 |
| Median Property Value | $620,200 |
What is the Average Price of Apartments for Sale in Union City, CA?
| Month | Median Price |
|---|---|
| Jun 2024 |
$397,499
|
| May 2024 |
$428,918
|
| Apr 2024 |
$478,834
|
| Mar 2024 |
$478,834
|
| Feb 2024 |
$478,834
|
| Jan 2024 |
$478,834
|
| Month | Median Price |
|---|---|
| Jun 2024 |
$637,354
|
| May 2024 |
$672,712
|
| Apr 2024 |
$601,389
|
| Mar 2024 |
$317,091
|
| Feb 2024 |
$317,091
|
| Jan 2024 |
$317,091
|
Household Income
The average household income in Union City, CA grew from $91,629 to $95,625 in the past year. This data is an estimate based upon 21,106 households in Union City, CA . The chart below presents how household income is distributed in Union City, CA in comparison to the revenue allocation amid households nationally.
Property Value
According to data from last year, the average property value in Union City, CA shifted from $561,200 to $620,200 throughout the year. The subsequent graph indicates the share of properties in the given price range in Union City, CA in comparison to the median property value in the same price segment across the country. According to the data, the greatest share of Union City, CA properties falls in the '$500,000 to $749,999' range, which is higher than the most significant median property across the country.
Rent vs. Own
Property Taxes
One of the most important aspects for property owners is the amount of property taxes. This graph shows distribution of property taxes in Union City, CA compared to median property taxes around the country. The prevalent amount of property taxes in Union City, CA equals $3000, which is less than the national average.