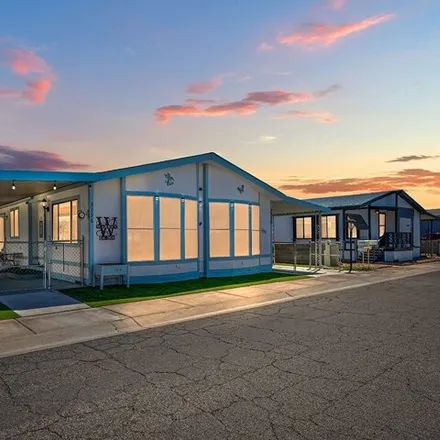
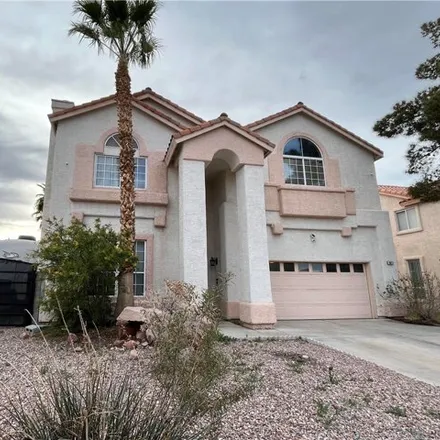
Whitney, NV, USA apartments for sale
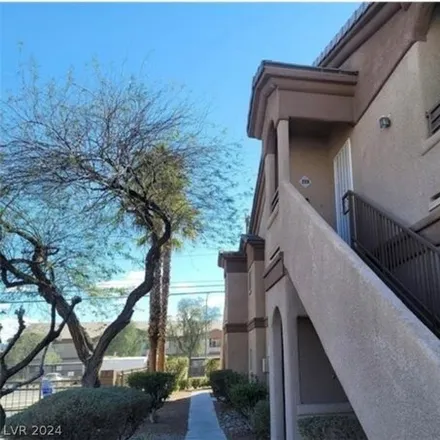
$214,900
$214,900
Available: Right Now
Welcome Home at Tera!! This rare find is in a gated community, you get to enjoy lush landscape living!! The pool with a BBQ, spa, exercise room and a clubhouse are just steps away! Mark your calendar for your next event! Plenty of guest parking too. ...

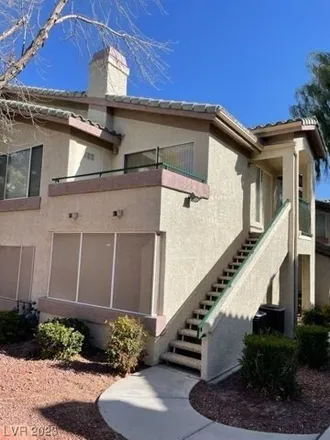
$180,000
$180,000
Available: Right Now
Welcome to your charming new home! This cozy 1-bed, 1-bath gated community condo is a perfect opportunity to get into home ownership. Step inside to find a bright open floor plan with natural light streaming through large windows. The living area is ...
$260,000
$260,000
Available: Right Now
Lovely 3 bedrooms 2 baths upper unit. neurtal carpeting , kitchen with eat-in area. living room with balcony ! Master bedroom with walk-in closet ! All appliances are included ! Pride of ownership. central location to shopping...

$315,000
$315,000
Available: Right Now
This charming townhouse features two spacious bedrooms, each with their own private bathroom! Open concept floorplan with the kitchen overlooking the family and dining area. An ideal space for both entertaining guests and enjoying quiet evenings at h...

$299,000
$299,000
Available: Right Now
Welcome Home!!!! This lovely home offers 3 bedrooms, 2 bathrooms and it was completely upgraded about 5 years ago. Home has been maintained and cared for!! This home offers a large main bedroom and lots of open space to entertain. It also has a priva...

$199,900
$199,900
Available: Right Now
Super affordable! Very well-kept cozy home featuring an open floor plan with high ceilings and windows throughout! Spacious bedrooms and large carport with room for 2 cars with plenty of space and a yard that is extremely easy to maintain. Wonderful ...
$459,000
$459,000
Available: Right Now
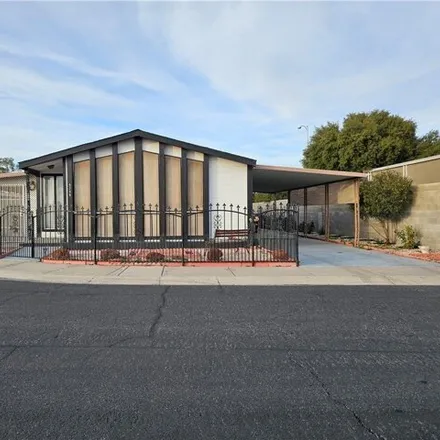
Immaculate 2story home in Booming Area of Las Vegas near Whitney Ranch. Home features 3 spacious bedrooms: 2 upstairs and 1 downstairs. 3 Full bathrooms. Primary suite have dual walk-in closets and large shower and separate soaking tub. Huge loft at ...

$299,900
$299,900
Available: Right Now
Welcome home to the Community of First Light At Boulder Ranch! This gated community has a pool and spa! The two bedroom 2 bath townhome with a garage is located in the heart of the community. The townhome is upstairs with vaulted ceilings with the at...

$239,000
$239,000
Available: Right Now
Beautifully remodeled 2 brm condo in Canyon Willow, featuring a lifestyle and comfort for the discerning owner. Relaxing pool area and convenient to all amenities, this condo ticks all the boxes. Beautiful inside and out with all new appliances in th...
$264,900
$264,900
Available: Right Now
55+ community , two community pools, community center, bocce ball courts, and security. Keep busy with a full social calendar for residents. Large corner lot. Fully fenced property with RV parking. Bonus room is 23x9, 11x9 workshop, and carport. Upda...

$169,999
$169,999
Available: Right Now
This move-in-ready 1st-floor condo in a gated community offers a cozy fireplace, laminate floors, and abundant natural light! Fully equipped with front loader Samsung washer and dryer, stainless steel refrigerator, 2 flat-screen TVs, water filter, an...

$565,900
$565,900
Available: Right Now
Location AND Layout - this home has it all! Vaulted ceilings greet you as you enter this open floorplan with newly remodeled entertainer's kitchen! Built in oven, quartz counters, and oversized breakfast bar. The built-ins in the family room and upst...
$369,900
$369,900
Available: Right Now
Welcome home to the community of South valley ranch in Henderson! This one story 3 bedroom home has 2 full baths and a large living room with a vaulted ceiling. The kitchen is the center of this home with an island and a pantry and a breakfast...
$340,000
$340,000
Available: Right Now
A single-story home in a 55+ community featuring 2bedrooms, 2bathrooms, and a kitchen facing the spacious living room, offering a comfortable living for any adults. This home has ceramic flooring throughout while wood laminate on both bedrooms. Plant...

$265,000
$265,000
Available: Right Now
Professionally renovated and Move-in ready ! Amazing value in today's market, hard to find a better home at this price Absolutely gorgeous 3-bed, 2-bath manufactured home in peaceful, age-restricted community Open floor-plan with contem...
$209,900
$209,900
Available: Right Now
Welcome home to the gated community of Tera! The community has a pool, spa, and an exercise room!! BBQ and grassy areas throughout the common areas. This upstairs corner condo has new carpet and fresh paint! A large living room, with balcony access. ...
$450,000
$450,000
Available: Right Now
Welcome to this exquisite one-story home nestled in a prestigious guard gated community. This charming residence boasts an open concept design, providing a seamless flow throughout the spacious living areas. With four bedrooms and three bathrooms, in...

$279,900
$279,900
Available: Right Now
Community of Rose Garden! The property has been Converted into Real property so you can get a loan! Open floor plan with 3 bedrooms and 2 full bathrooms. Spacious Kitchen. Separate dining room with a bright vaulted ceiling living room. ...

$189,900
$189,900
Available: Right Now
This spacious modular home is a fantastic investment opportunity for those looking to capitalize on a property with incredible potential. 55+ community. Currently in fair shape, this home requires some updates to bring it up to modern standards, but ...
$200,000
$200,000
Available: Right Now
Adorable home near Stallion Mountain in 55+ community with 2 bedrooms and 2 full bathrooms. Huge living room, kitchen has plenty of room for lots of cooking to be done. Upgraded flooring , no carpet. Big lot with plenty of storage and shed in ...
$295,000
$295,000
Available: Right Now
One of the biggest in the neighborhood! Well cared for and maintained. Do not skip out on viewing this one. You own the land - converted to Real property ! This is huge for you !!! Updated landscaping with synthetic grass. Covered front...
$555,000
$555,000
Available: Right Now
Welcome to South Valley Ranch. This is one of the largest homes in the neighborhood. You'll enter to the foyer with vaulted ceilings that continue throughout the downstairs. On the left there is a Living Room/Formal Dining Room with a Fireplace. Down...
Whitney
According to statistics, the population in Whitney, NV amounts to 43,955, which shows growth 7% compared to the previous year. The median age of the city’s residents is 35. The average household income is $50,070, shifting growth 3% from the past year, and the average property value in Whitney, NV growth 14% to $142,200 throughout the year.
| Population | 43,955 |
| Median Age | 35.4 |
| Poverty Rate | 15% |
| Household Income | $50,070 |
| Number Of Employees | 21,055 |
| Median Property Value | $142,200 |
What is the Average Price of Apartments for Sale in Whitney, NV?
| Month | Median Price |
|---|---|
| Jun 2024 |
$421,589
|
| May 2024 |
$353,135
|
| Apr 2024 |
$366,958
|
| Mar 2024 |
$366,958
|
| Feb 2024 |
$366,958
|
| Jan 2024 |
$366,958
|
| Month | Median Price |
|---|---|
| Jun 2024 |
$388,600
|
| May 2024 |
$376,459
|
| Apr 2024 |
$358,287
|
| Mar 2024 |
$358,287
|
| Feb 2024 |
$358,287
|
| Jan 2024 |
$358,287
|
Household Income
The average household income in Whitney, NV grew from $48,675 to $50,070 in the past year. This data is an estimate based upon 14,875 households in Whitney, NV . The chart below presents how household income is distributed in Whitney, NV in comparison to the revenue allocation amid households nationally.
Property Value
According to data from last year, the average property value in Whitney, NV shifted from $125,000 to $142,200 throughout the year. The subsequent graph indicates the share of properties in the given price range in Whitney, NV in comparison to the median property value in the same price segment across the country. According to the data, the greatest share of Whitney, NV properties falls in the '$125,000 to $149,999' range, which is lower than the most significant median property across the country.
Rent vs. Own
Property Taxes
One of the most important aspects for property owners is the amount of property taxes. This graph shows distribution of property taxes in Whitney, NV compared to median property taxes around the country. The prevalent amount of property taxes in Whitney, NV equals $1150, which is less than the national average.