Winchester, NV, USA apartments for sale
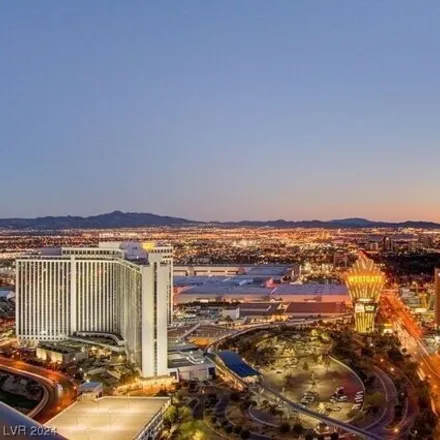
$710,000
$710,000
Available: Right Now
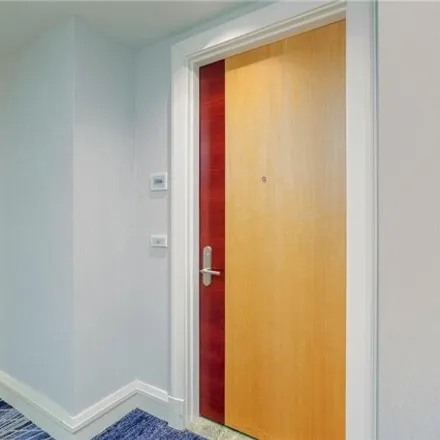
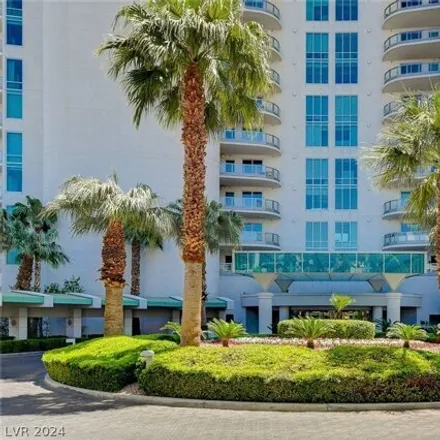
Prime high floor residence 36 stories high overlooking the strip, mountains, city lights and golf course views !!! Located in exclusive turnberry towers west ( The newer tower ). Penthouse feel with double terraces and open la...

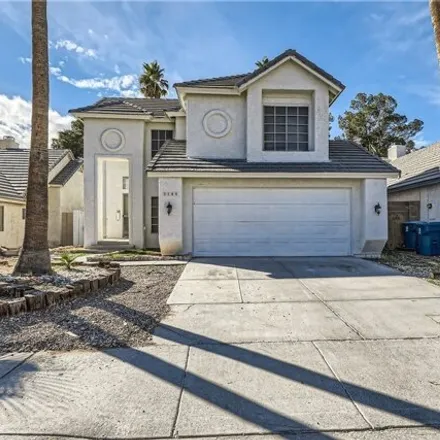
$460,000
$460,000
Available: Right Now
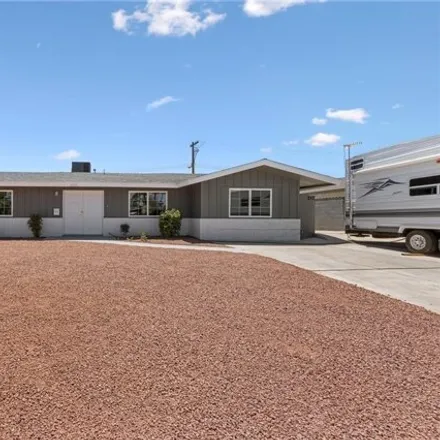
Stunning 2-story home in a gated community ! This luxurious property features 5 bedrooms and 3 bathrooms, with new luxury vinyl and padded carpet flooring throughout. the gourmet kitchen has stainless steel appliances, a built-in microwave,...
$425,000
$425,000
Available: Right Now
Spacious 2-story home with vaulted ceilings, open layout, fireplace, and tile floors. Outside, enjoy large pool and spa, fenced in for safety. New laminate flooring , fresh new paint, lots of natural light. Primary bedroom with balcony overloo...
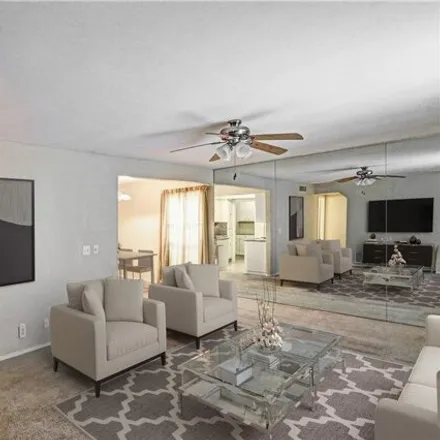
$315,000
$315,000
Available: Right Now
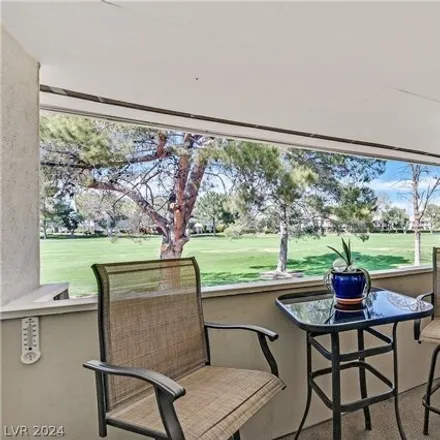
Welcome to luxury living at its finest in the highly coveted Las Vegas Country Club. This guard-gated community offers exclusivity and tranquility. Step into elegance with this 2-bed, 2-bath sanctuary boasting 1200 sq ft of meticulously designed livi...
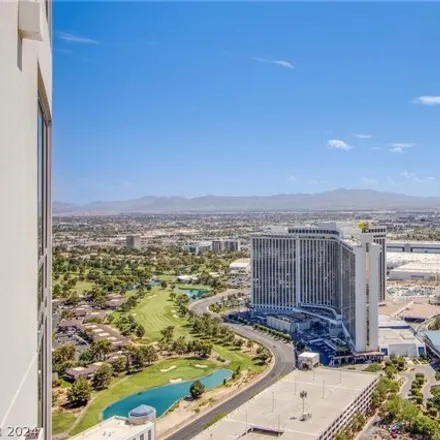
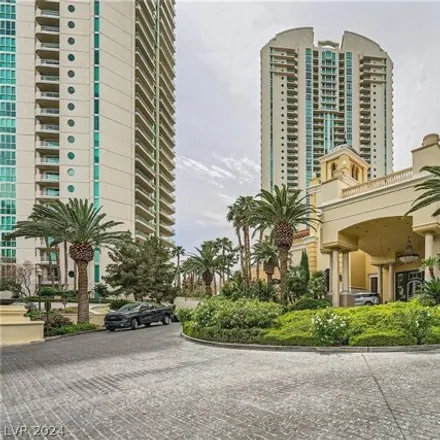
$1,1M
$1,1M
Available: Right Now
Luxury living here at the Turnberry Towers West you'll find this beautiful 2 bed/2.5 bath condo , located on the 44th floor with exquisite views that are sure to leave you speechless! This unit has 2 assigned parking spaces !! No expense spare...
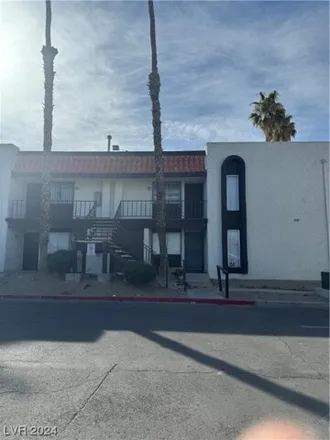
$149,888
$149,888
Available: Right Now
Great Location close to Las Vegas International Country Club and the Strip, Shopping, Dining, Entertainment, UNLV Hospital and interstate....whatever the need it's close...Very Spacious 2 bedroom 2 bath on the second floor....Balcony to sit and chill...
$2,5M
$2,5M
Available: Right Now
Live grand in this immaculate unit at turnberry place ! Spacious 4, 103 sq ft + 585 ft balcony oasis w/ private foyer, grand living, 3 beds, and 4.5 baths. prime suite boasts his and Hers quarters. laundry, storage, 2 c...
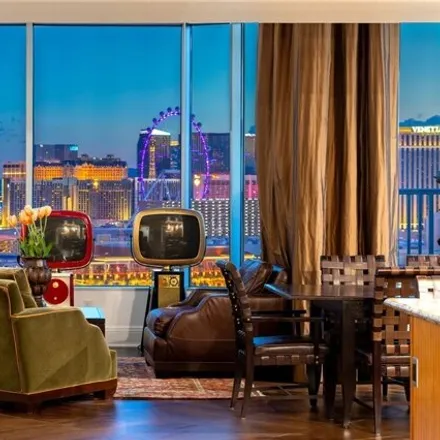
$2,7M
$2,7M
Available: Right Now
Welcome to Skyline: This exquisite penthouse redefines opulent living with its unrivaled vistas of the iconic Las Vegas Strip and the new MSG Sphere at your fingertips. Perched high above the city with an1, 100sq ft terrace, this exclusive condominiu...
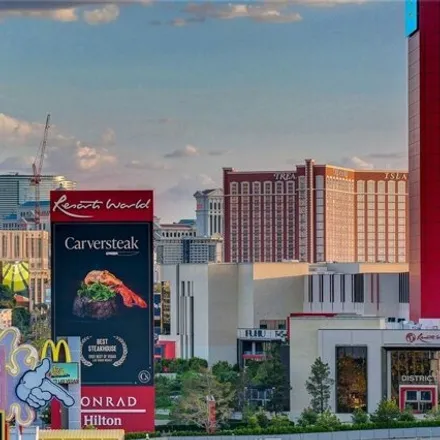
$999,999
$999,999
Available: Right Now
WOW ! Properties like this rarely come on the market : one of a kind custom unit overlooking south las vegas strip and the newest mega resorts fountainebleau and resort world ! VEWES ! VIEWS ! This is a true entertainer 'S DREAM ! Lo...
$289,900
$289,900
Available: Right Now
Incredible opportunity! This upstairs condo offers breathtaking golf course views in the prestigious Las Vegas Country Club, a secure, guard-gated community. Unbeatable location: just 5 minutes from the Strip and 10 minutes from the airport! Ready to...

$499,900
$499,900
Available: Right Now
Beautifully decorated and recently updated... Let's start big- It's Paradise Palms - Clark County's only historically designated neighborhood. Zooming in - we have Fountainbleu Estates which is one of the more popular parts of Paradise Palms, and fin...

$395,000
$395,000
Available: Right Now
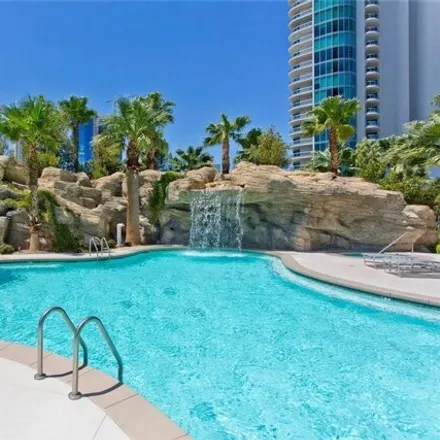
Stunning Turnberry Towers West 1Bd/1.5Bth 14th Floor 05 unit directly above the pool and waterfalls below! 24 x24 White Porcelain flooring, Granite Counters, Marble Flooring in baths, NEST Thermostat, Walk-In Closet, Bosch Washer/Dryer, 12 acres of L...
$395,000
$395,000
Available: Right Now
Luxurious 1-Bedroom Condo on the 36th Floor of Sky Tower. Nestled on the iconic Las Vegas Strip, this home offers breathtaking views of the renowned Fountainbleu and the vibrant cityscape. Upon entering, youll be greeted by an open and airy floor pla...

$615,000
$615,000
Available: Right Now
Paragon amg, the top provider of luxury renovated homes in Las Vegas, has released their latest outstanding creation in the iconic Regency Tower in the prestigious Las Vegas Country Club. This high-rise unit with views of Downtown Las Vegas, t...
$849,000
$849,000
Available: Right Now
Exquisite 2 bed/2 bath with Den at the prestigious Turnberry Towers West! Located on the 38th floor, you will find breathtaking views and lots of natural light throughout with floor-to-ceiling windows. The primary bedroom has a large, spacious walk-i...
$781,000
$781,000
Available: Right Now
Introducing a remarkable opportunity , zillow zestimate $801, 000 ! Well maintained 4-plex nestled in the charming community of El Sol Del Pueblo.This property boasts a strategic location with a combination of one 3-bedroom unit and three 2-be...
$635,000
$635,000
Available: Right Now
Breathtaking 2 Bedroom, 2 Bathroom Luxury High Rise that Boasts: Granite Countertops, Solid Wood Cabinetry, Kitchen Hood, Bosch Dishwasher, New Subzero Refrigerator, Full-Size LG Stackable Washer and Dryer, Wine Cooler, Jetted Tub in Bathroom, Glass ...

$205,000
$205,000
Available: Right Now
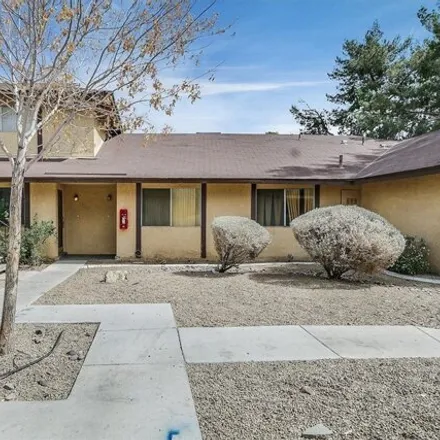
Charming 2-bedroom, 873 sq ft condo located at 350 E Desert Inn Rd, Building F104, in the desirable Country Club Shadows community. This cozy unit is perfectly situated near the Fountainbleau, Las Vegas Convention Center, Marriott, and the Wynn and E...

$264,999
$264,999
Available: Right Now
Guard Gated, CLEAN,1st floor condo boasting 16thFAIRWAYviews on the legendary Las Vegas Country Club G.C.! Unit features 2 large bedrooms, granite countertops, tile flooring in kitchen and bathroom, huge 15' walk in closet in primary suite, large sec...

$195,000
$195,000
Available: Right Now
Experience Las Vegas living at its finest in this exquisite one-bedroom condo located in the Historic Las Vegas International Country Club Estates. Boasting a beautiful view of the sparkling pool, this residence offers both elegance and comfort. Cent...
$429,999
$429,999
Available: Right Now
Feast your eyes on this slice of paradise! This Stunning 5 bedroom home withNO HOAis ready for your personal touch! Home has been fully renovated and holds countless upgrades such as Ceramic Flooring, Custom Cabinets, Granite Countertops in both Kitc...
$588,000
$588,000
Available: Right Now
Stunning Furnished Luxury 2 Bedroom/2 Bath Condo at Turnberry Towers! Fabulous Views of the Sparkling Waterfall Pool, Las Vegas Country Club Golf Course, Mountains and City Lights. Open Floor Plan with Beautiful Tile Floors and Custom Paint! Large Ow...
Winchester
According to statistics, the population in Winchester, NV amounts to 28,130, which shows decline 1% compared to the previous year. The median age of the city’s residents is 39. The average household income is $39,642, shifting growth 3% from the past year, and the average property value in Winchester, NV growth 5% to $135,100 throughout the year.
| Population | 28,130 |
| Median Age | 38.9 |
| Poverty Rate | 20% |
| Household Income | $39,642 |
| Number Of Employees | 14,171 |
| Median Property Value | $135,100 |
What is the Average Price of Apartments for Sale in Winchester, NV?
| Month | Median Price |
|---|---|
| Jun 2024 |
$480,208
|
| May 2024 |
$422,959
|
| Apr 2024 |
$488,180
|
| Mar 2024 |
$488,180
|
| Feb 2024 |
$488,180
|
| Jan 2024 |
$488,180
|
| Month | Median Price |
|---|---|
| Jun 2024 |
$552,999
|
| May 2024 |
$533,762
|
| Apr 2024 |
$590,396
|
| Mar 2024 |
$446,591
|
| Feb 2024 |
$446,591
|
| Jan 2024 |
$446,591
|
Household Income
The average household income in Winchester, NV grew from $38,352 to $39,642 in the past year. This data is an estimate based upon 11,200 households in Winchester, NV . The chart below presents how household income is distributed in Winchester, NV in comparison to the revenue allocation amid households nationally.
Property Value
According to data from last year, the average property value in Winchester, NV shifted from $128,300 to $135,100 throughout the year. The subsequent graph indicates the share of properties in the given price range in Winchester, NV in comparison to the median property value in the same price segment across the country. According to the data, the greatest share of Winchester, NV properties falls in the '$150,000 to $174,999' range, which is lower than the most significant median property across the country.
Rent vs. Own
Property Taxes
One of the most important aspects for property owners is the amount of property taxes. This graph shows distribution of property taxes in Winchester, NV compared to median property taxes around the country. The prevalent amount of property taxes in Winchester, NV equals $800, which is less than the national average.